Fig. 41.
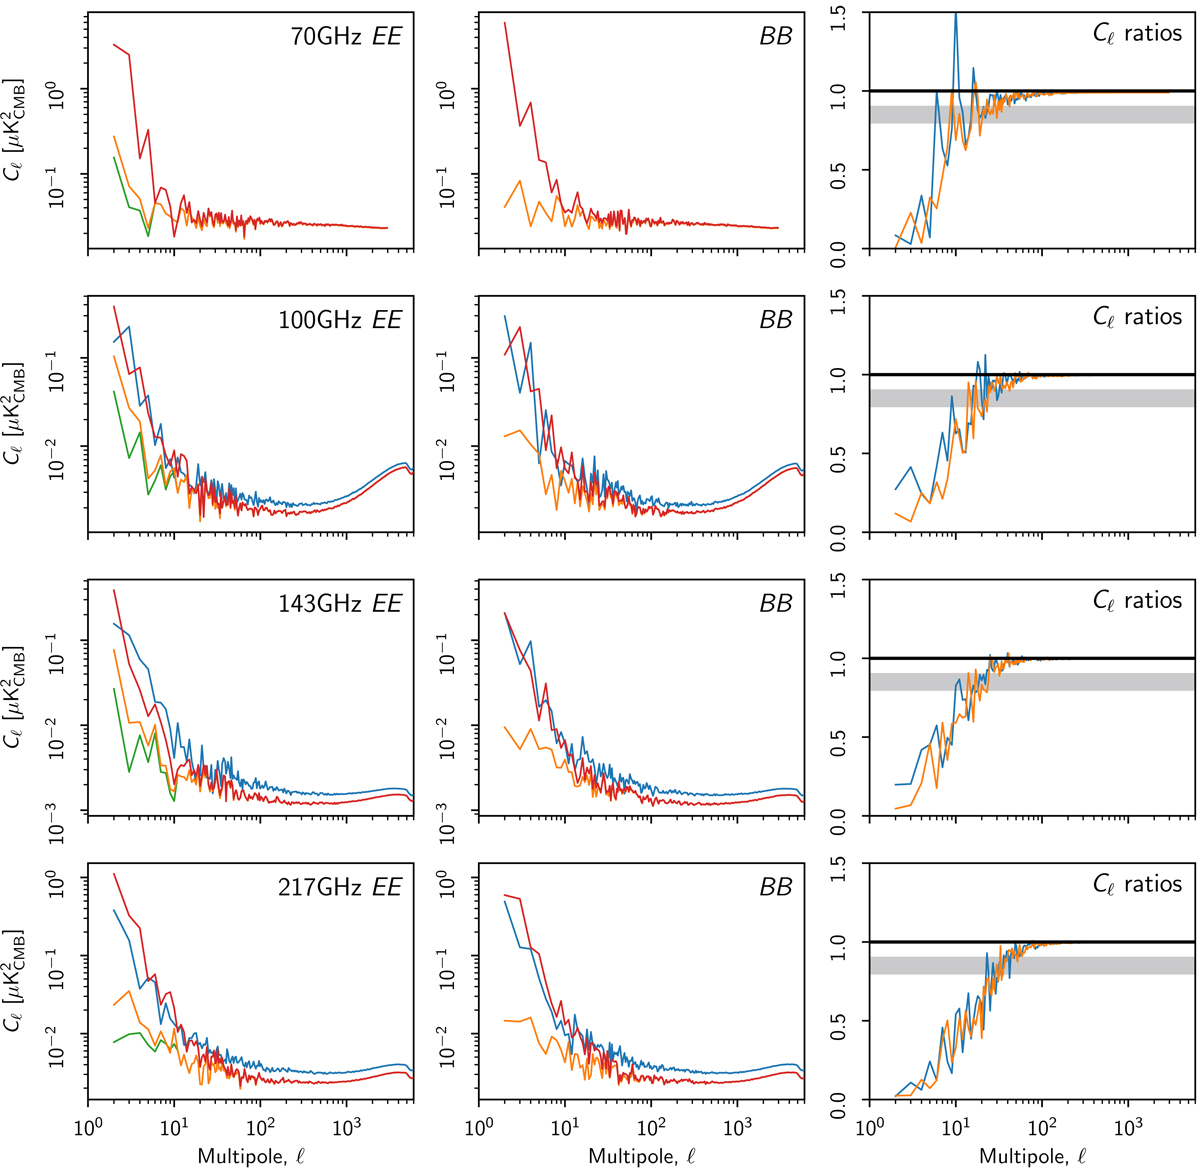
Effect of the polarization prior on EE and BB detector-set difference power spectra. For 100–217 GHz, the green, orange, and blue lines on the EE and BB plots are the same as in Fig. 40 but here we add a red line, showing the power spectra for an alternative version of the NPIPE detector-set maps that are computed without the polarization prior. There is no blue line at 70 GHz because there is no comparable detector-set split in PR3, and 353 GHz is not shown because it is always calibrated without the polarization prior.
Current usage metrics show cumulative count of Article Views (full-text article views including HTML views, PDF and ePub downloads, according to the available data) and Abstracts Views on Vision4Press platform.
Data correspond to usage on the plateform after 2015. The current usage metrics is available 48-96 hours after online publication and is updated daily on week days.
Initial download of the metrics may take a while.