Fig. 40.
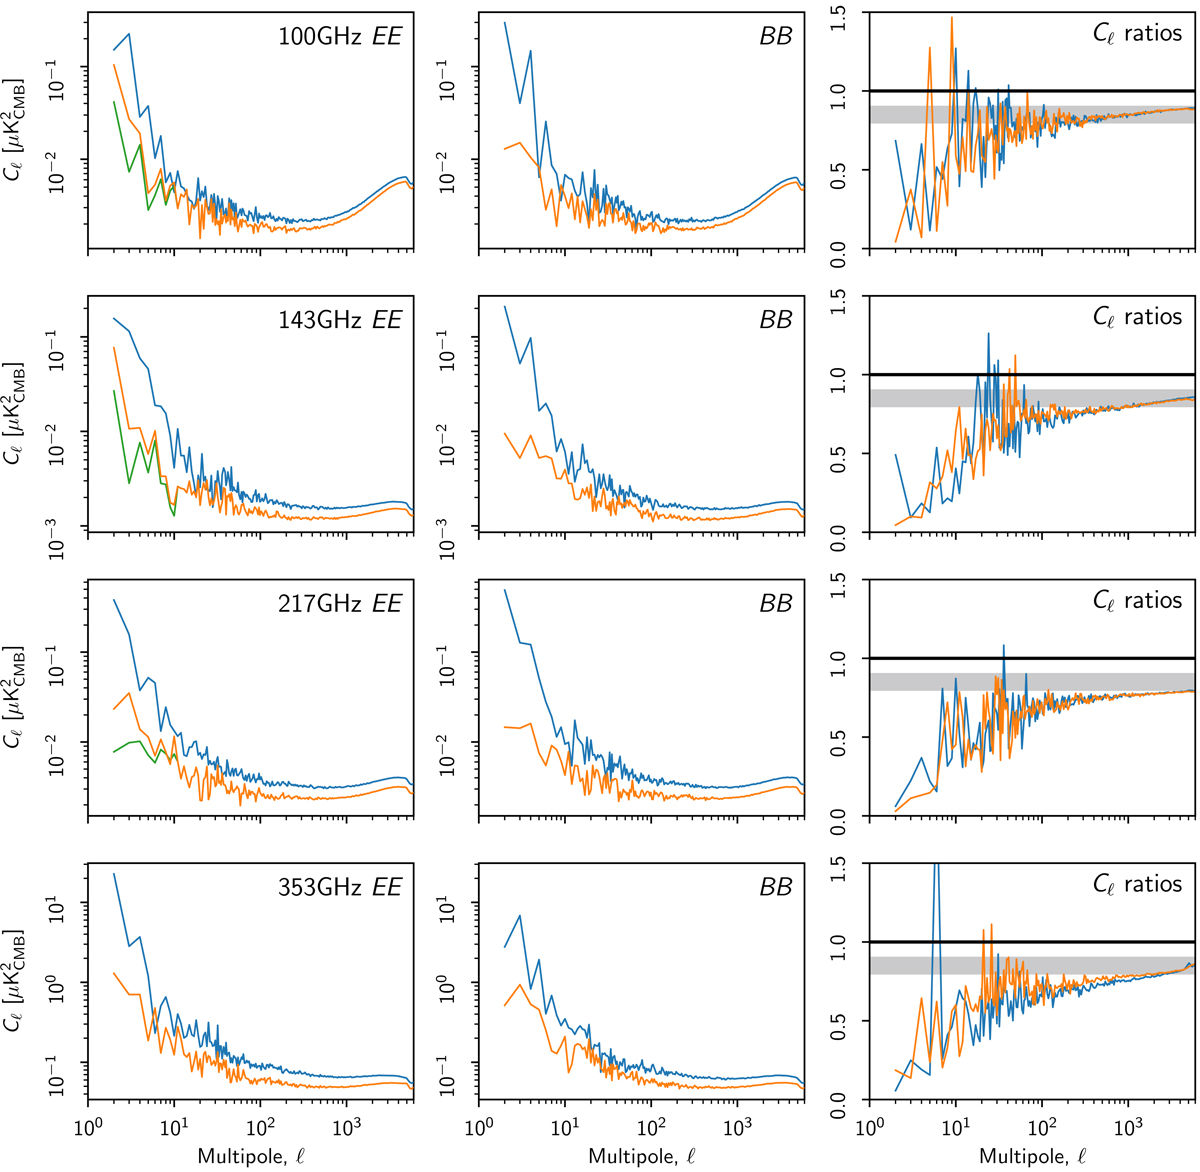
EE and BB detector-set difference power spectra. The first two columns show PR3 (blue), raw NPIPE (green), and transfer-function-corrected NPIPE (orange) null-map power spectra. Note that PR3 detector sets are not the same as were differenced for Fig. 14 in Planck Collaboration III (2020), but rather ones that were destriped independently. The third column of panels shows the transfer-function-corrected NPIPE/2018 EE and BB ratios in blue and orange, respectively. NPIPE has notably less power at all angular scales. The grey band in the third column indicates a 10–20% improvement in power. These spectra are computed over 50.4% of the sky, corrected for the sky fraction and binned into 300 logarithmically-spaced bins. The polarization amplitudes of 2015, 2018, and NPIPE detector-set difference maps are shown in Fig. 39.
Current usage metrics show cumulative count of Article Views (full-text article views including HTML views, PDF and ePub downloads, according to the available data) and Abstracts Views on Vision4Press platform.
Data correspond to usage on the plateform after 2015. The current usage metrics is available 48-96 hours after online publication and is updated daily on week days.
Initial download of the metrics may take a while.