Free Access
Fig. 39.
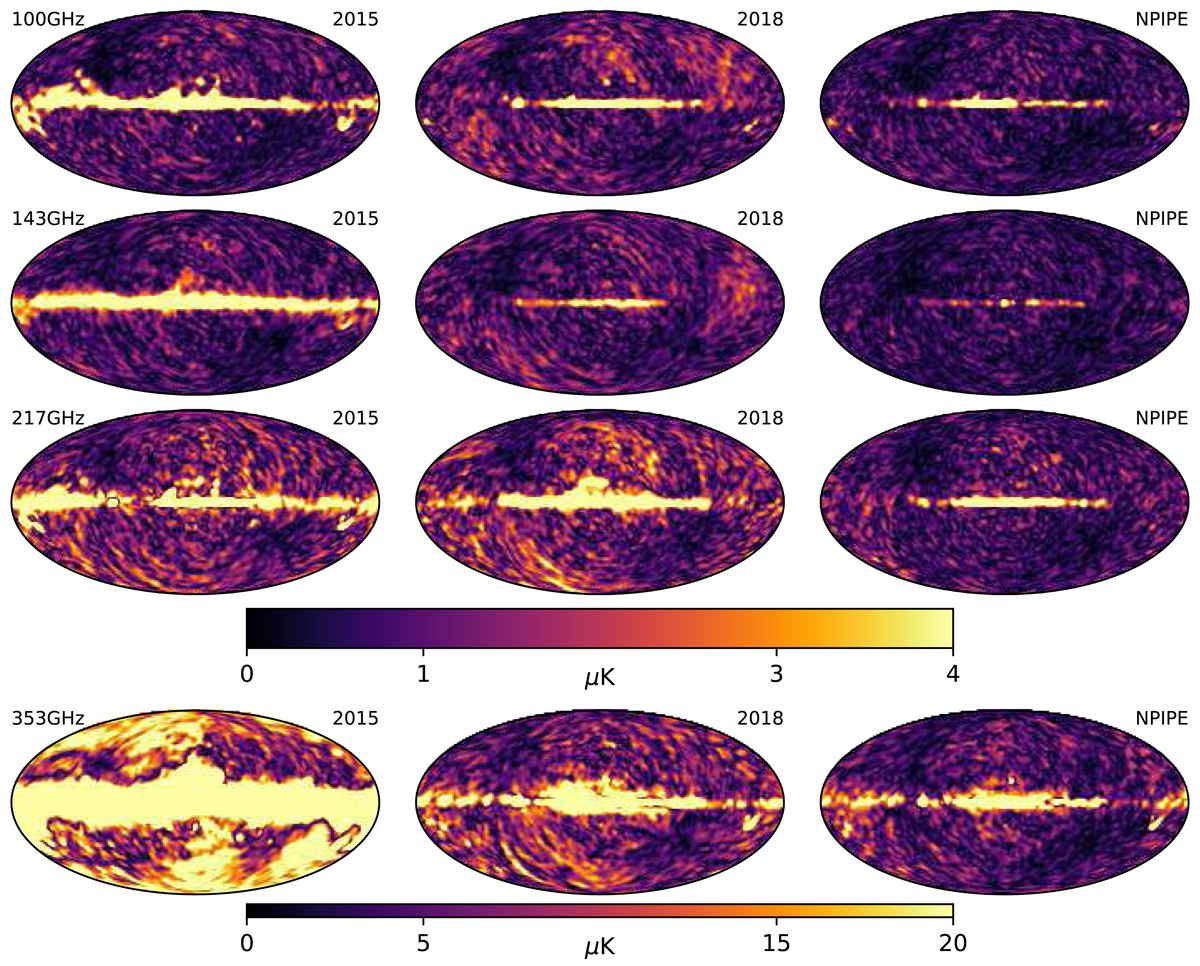
Polarization amplitudes of the detector-set difference null maps. The angular power spectra of PR3 and NPIPE maps are shown in Fig. 40. Independent processing of the two detector-sets means that these maps reflect the level of total residuals in the frequency maps.
Current usage metrics show cumulative count of Article Views (full-text article views including HTML views, PDF and ePub downloads, according to the available data) and Abstracts Views on Vision4Press platform.
Data correspond to usage on the plateform after 2015. The current usage metrics is available 48-96 hours after online publication and is updated daily on week days.
Initial download of the metrics may take a while.