Fig. 38.
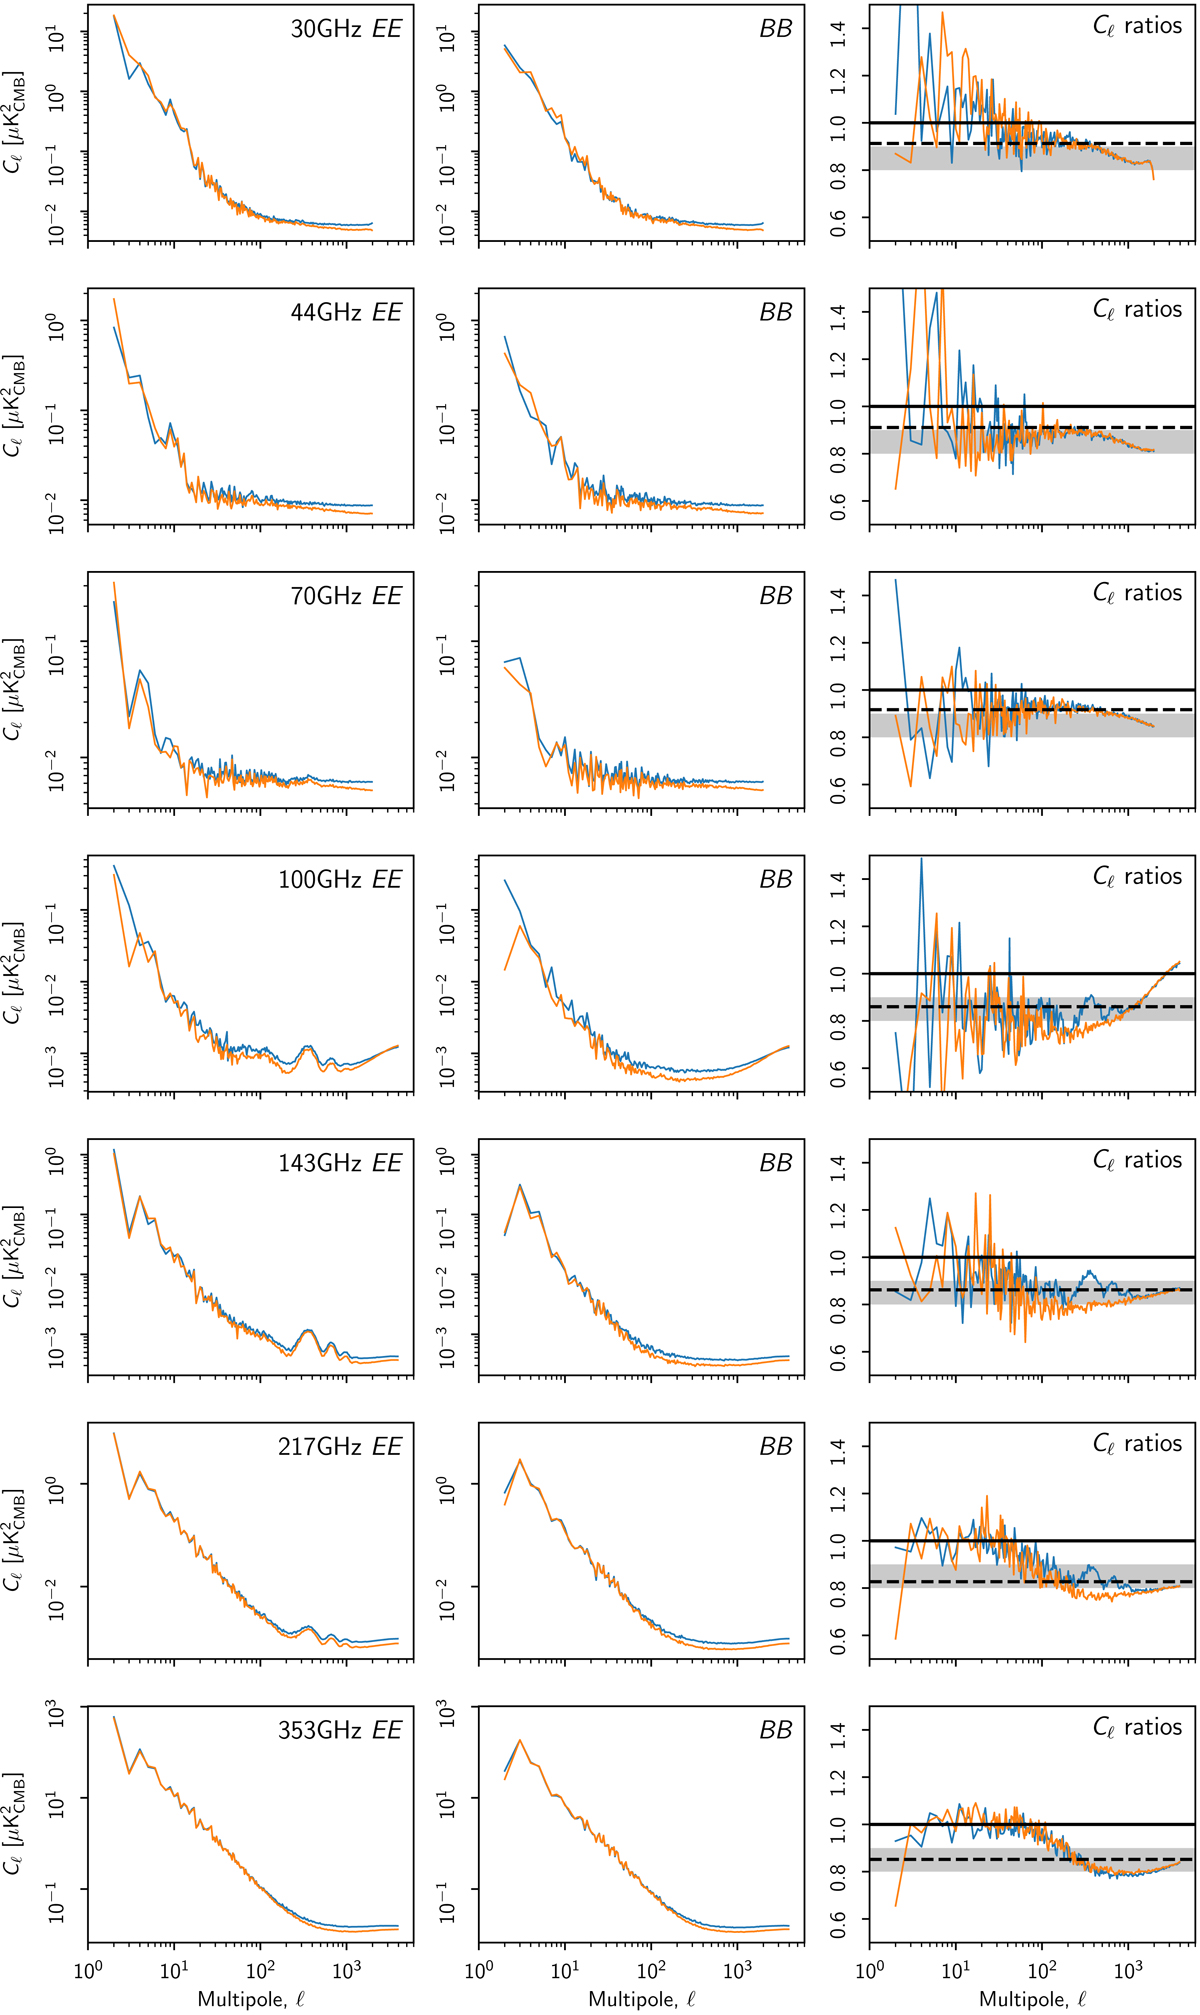
EE and BB auto-spectra of the polarized frequency maps. The first two columns show PR3 (blue) and NPIPE (orange) auto-spectra, while the third column shows the ratios (NPIPE/2018) with EE in blue and BB in orange. For noise-dominated angular scales, NPIPE maps have 10–20% lower noise variance, indicated by the grey band in the ratio plot. We show a naive estimate of the ratios, based on the ratio of masked pixel hits in Table 1, as a dashed black line. These spectra are computed over 50.4% of the sky, corrected for the sky fraction and binned into 300 logarithmically-spaced bins.
Current usage metrics show cumulative count of Article Views (full-text article views including HTML views, PDF and ePub downloads, according to the available data) and Abstracts Views on Vision4Press platform.
Data correspond to usage on the plateform after 2015. The current usage metrics is available 48-96 hours after online publication and is updated daily on week days.
Initial download of the metrics may take a while.