Fig. 36.
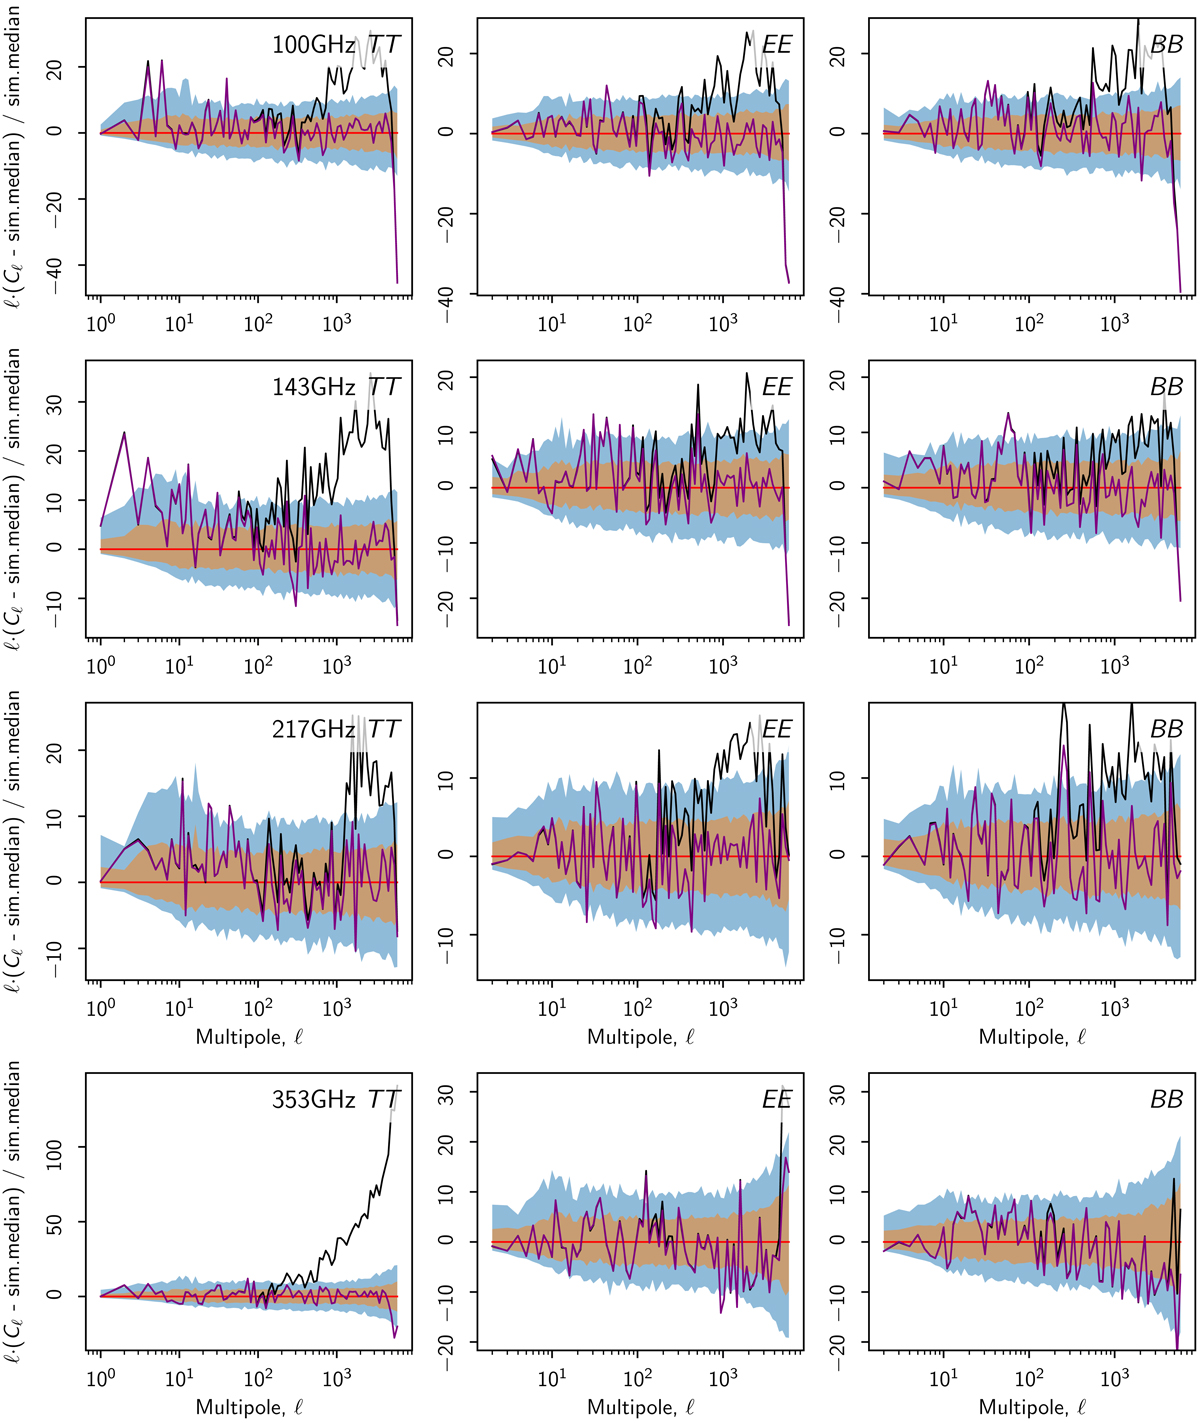
Simulated A/B difference versus flight data at the HFI frequencies where we identify a percent-level, scale-dependent deficit in simulated noise power. The flight data power spectrum is differenced and divided by the median of the uncorrected simulations (black) and, alternatively, by the simulated maps that include the noise correction (purple). The coloured bands represent the asymmetric 68% and 95% confidence regions. The power spectra are binned into 100 logarithmically spaced bins. Apart from the wider binning, the black curves and the confidence limits are the same as those shown in Figs. 28 and 29.
Current usage metrics show cumulative count of Article Views (full-text article views including HTML views, PDF and ePub downloads, according to the available data) and Abstracts Views on Vision4Press platform.
Data correspond to usage on the plateform after 2015. The current usage metrics is available 48-96 hours after online publication and is updated daily on week days.
Initial download of the metrics may take a while.