Fig. 34.
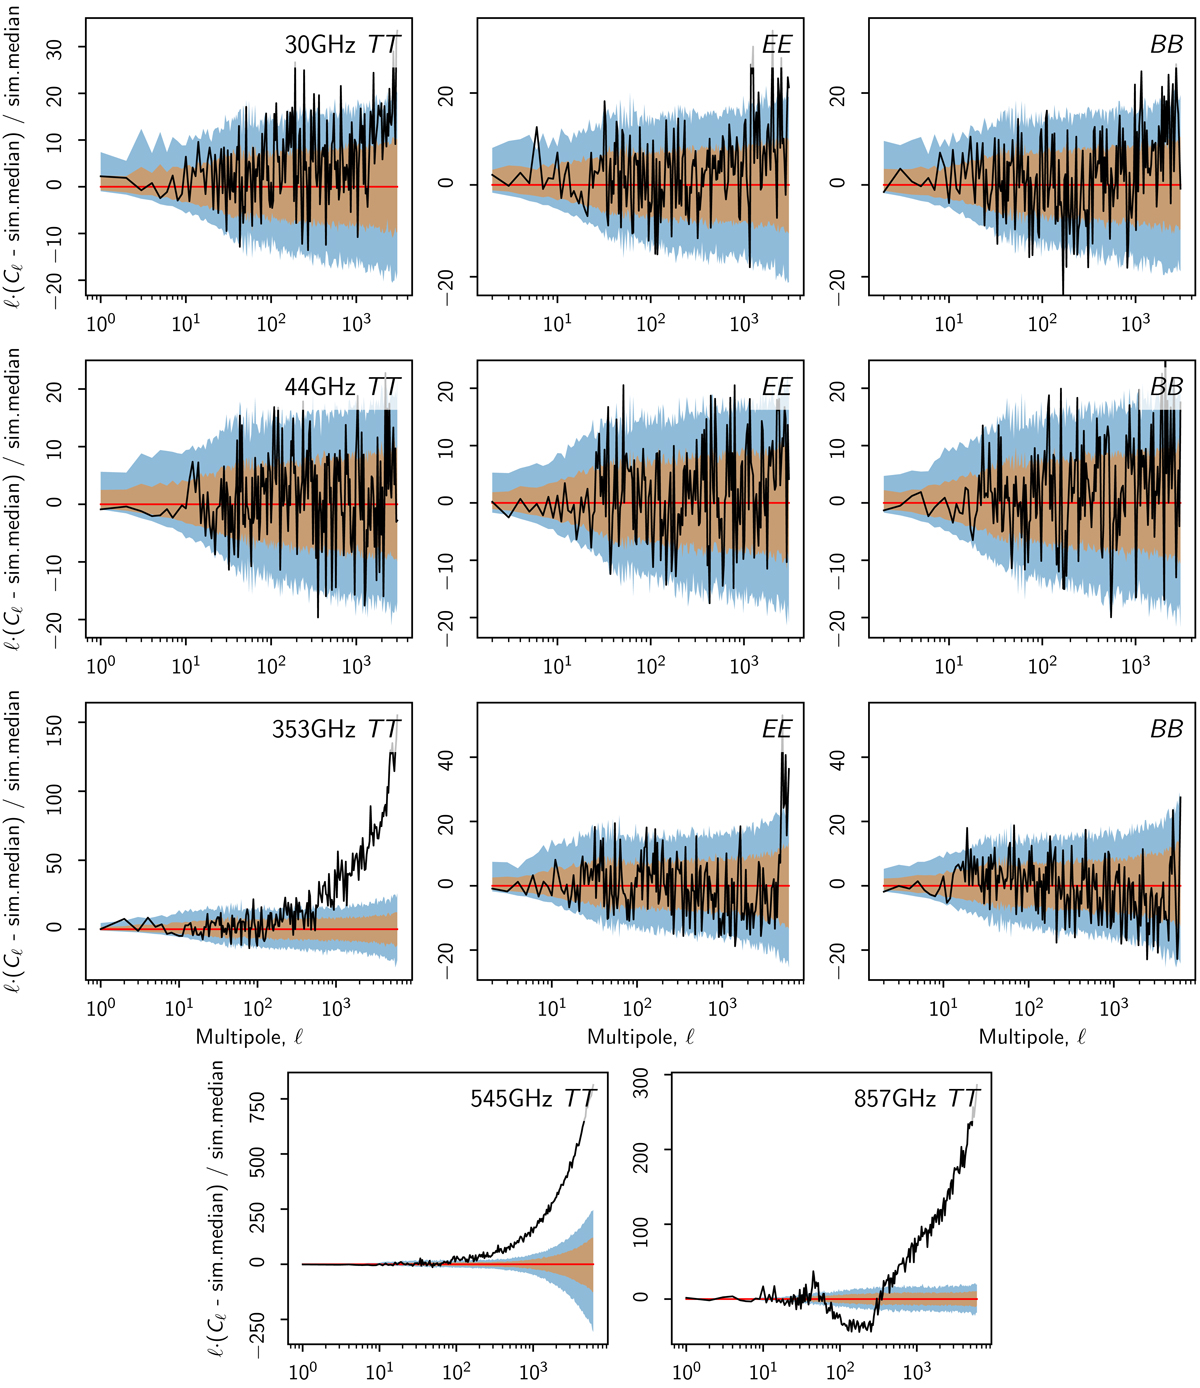
Simulated A/B difference versus flight data at 30, 44, 353, 545, and 857 GHz. All spectra are differenced and divided by the median simulated spectrum. The flight data are shown in black, and the median simulated power in each bin is plotted in red. The coloured bands represent the asymmetric 68% and 95% confidence regions. The power spectra are binned into 300 logarithmically-spaced bins. The spectra shown here are the same as in Fig. 28. Notice the ℓ-scaling.
Current usage metrics show cumulative count of Article Views (full-text article views including HTML views, PDF and ePub downloads, according to the available data) and Abstracts Views on Vision4Press platform.
Data correspond to usage on the plateform after 2015. The current usage metrics is available 48-96 hours after online publication and is updated daily on week days.
Initial download of the metrics may take a while.