Fig. 32.
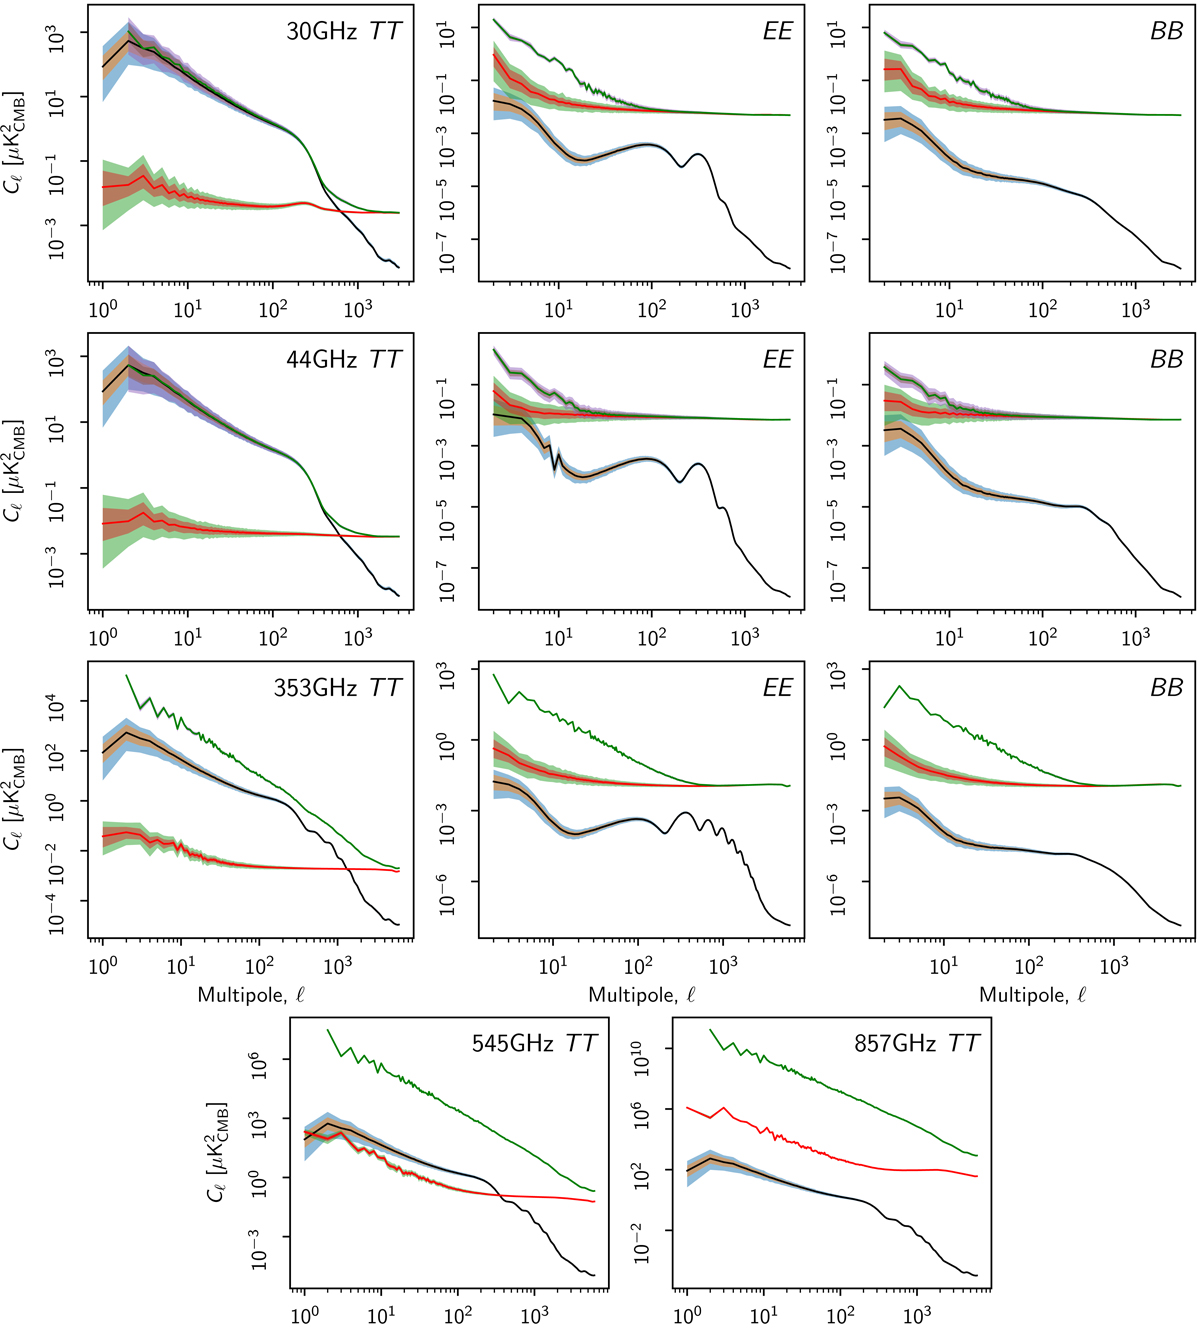
Simulated CMB, noise, and systematics pseudo-spectra at 30, 44, 353, 545, and 857 GHz. The median CMB power in each bin is plotted in black, and the median noise and systematics power (difference between the input and output maps) in red. The coloured bands represent the asymmetric 68% and 95% confidence regions. The power spectra are binned into 300 logarithmically-spaced bins. The CMB is convolved with the beam and E-mode transfer function (Sect. 4.3). The large-scale CMB B-mode power in these plots follows from mode coupling and is not intrinsic to the simulations.
Current usage metrics show cumulative count of Article Views (full-text article views including HTML views, PDF and ePub downloads, according to the available data) and Abstracts Views on Vision4Press platform.
Data correspond to usage on the plateform after 2015. The current usage metrics is available 48-96 hours after online publication and is updated daily on week days.
Initial download of the metrics may take a while.