Fig. 27.
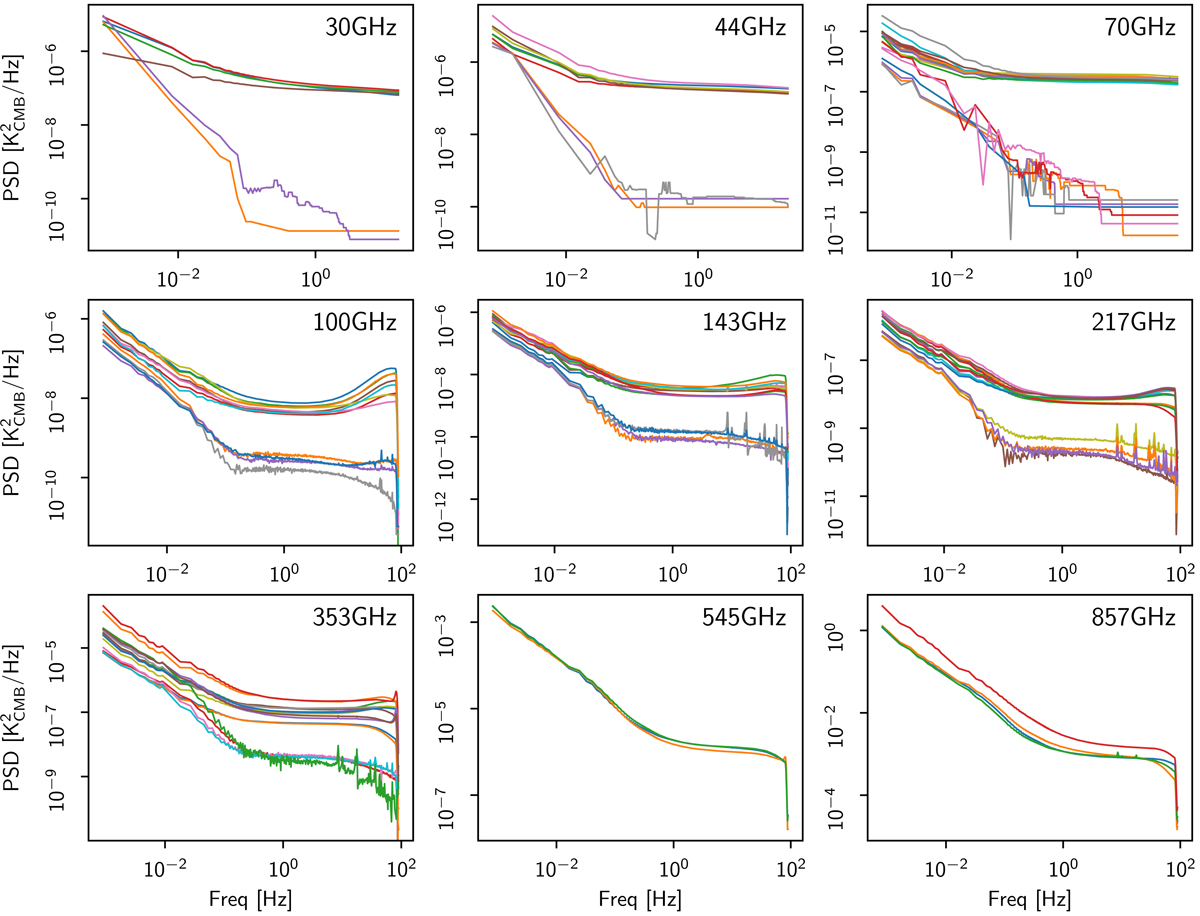
Averaged noise PSDs for each detector (upper curves) and correlated-noise modes for each polarized horn (lower curves). The total noise power is the sum of the correlated and uncorrelated modes. These noise PSDs are measured from the data by subtracting a signal estimate and then evaluating the sample-sample covariance function. The HFI noise is suppressed near the Nyquist frequency (≈90 Hz) by the bolometric transfer function filtering. The PSDs are used for simulating the 1/f noise fluctuations, and as inputs to the Madam noise filter for destriping.
Current usage metrics show cumulative count of Article Views (full-text article views including HTML views, PDF and ePub downloads, according to the available data) and Abstracts Views on Vision4Press platform.
Data correspond to usage on the plateform after 2015. The current usage metrics is available 48-96 hours after online publication and is updated daily on week days.
Initial download of the metrics may take a while.