Free Access
Fig. 23.
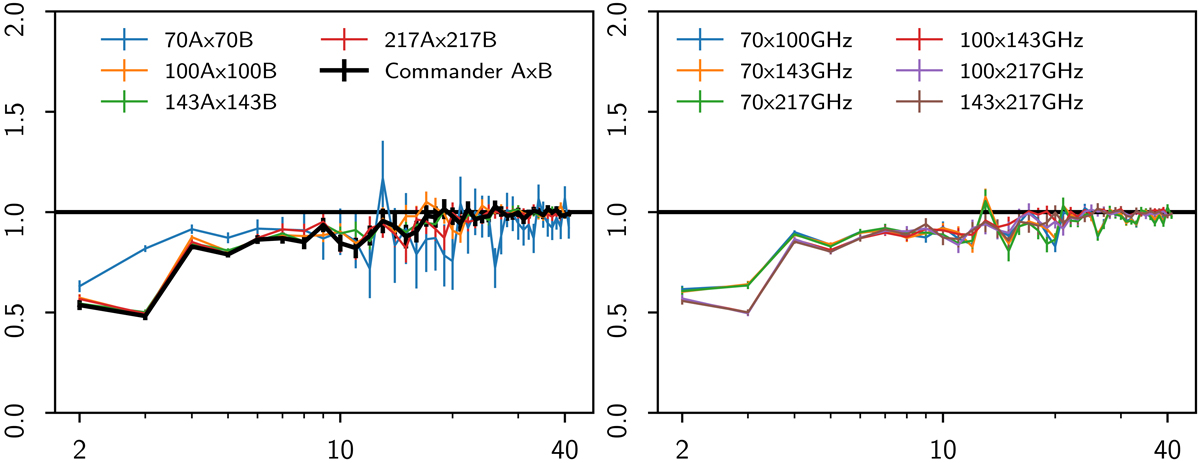
NPIPE E-mode cross-spectrum transfer functions measured by comparing simulated CMB input and foreground-cleaned output maps over 60% of the sky. Left: detector-set cross-spectra. Right: frequency cross-spectra.
Current usage metrics show cumulative count of Article Views (full-text article views including HTML views, PDF and ePub downloads, according to the available data) and Abstracts Views on Vision4Press platform.
Data correspond to usage on the plateform after 2015. The current usage metrics is available 48-96 hours after online publication and is updated daily on week days.
Initial download of the metrics may take a while.