Fig. 22.
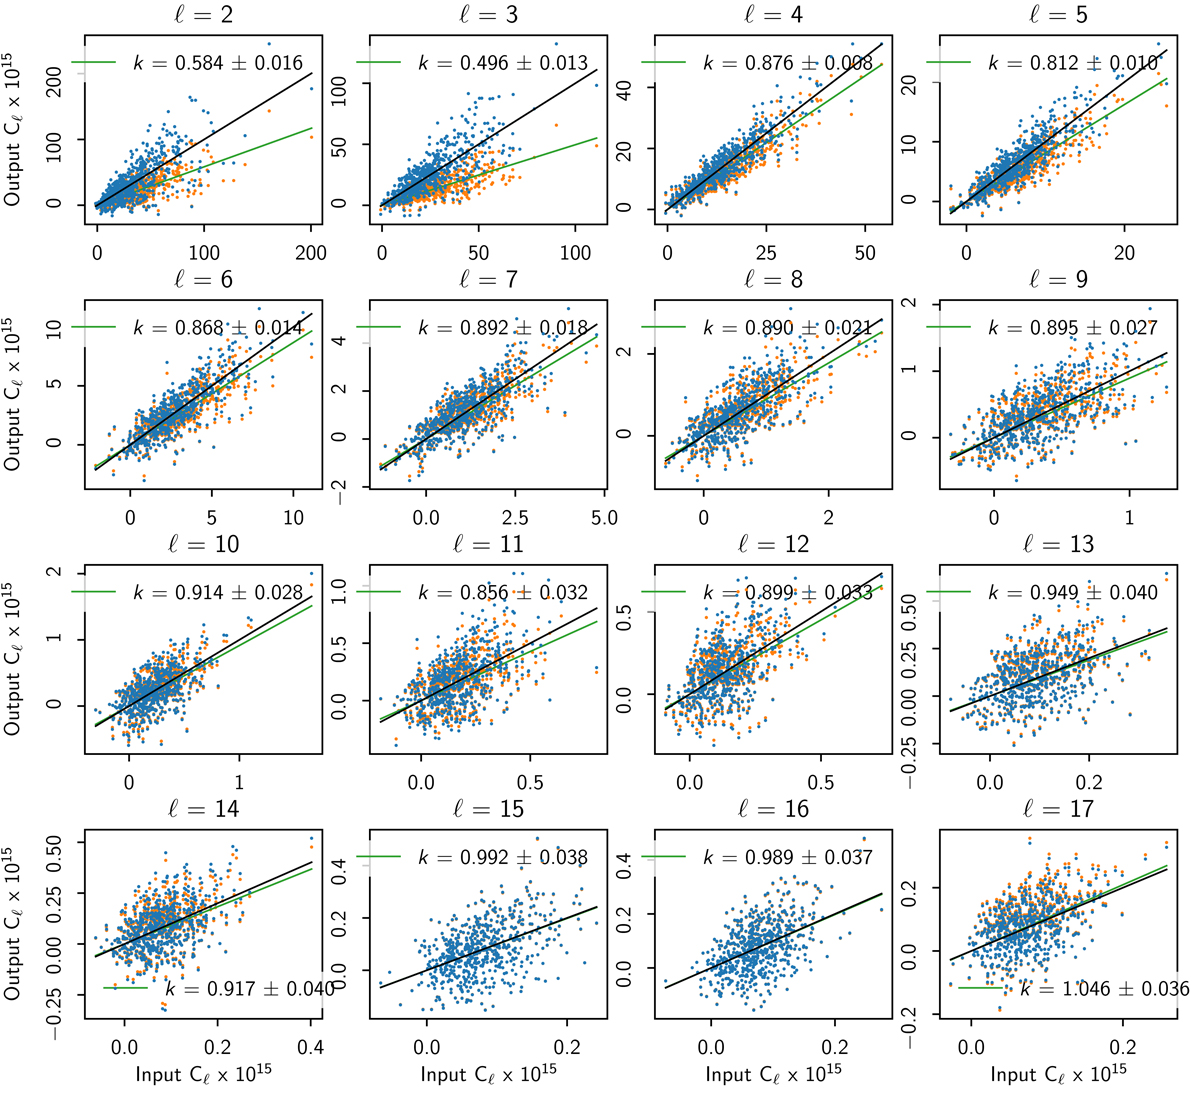
Measuring the NPIPE large-scale polarization transfer function by comparing the simulated input and output CMB power multipole by multipole at 100 GHz and with 60% sky fraction. The output power spectrum is measured by removing the foreground from the simulated frequency map and then measuring the cross-spectrum with the input CMB map. The orange data points show input versus output before the transfer function correction. Their slope is shown in green. The blue data points show the corrected input versus output. Their (unity) slope is shown in black.
Current usage metrics show cumulative count of Article Views (full-text article views including HTML views, PDF and ePub downloads, according to the available data) and Abstracts Views on Vision4Press platform.
Data correspond to usage on the plateform after 2015. The current usage metrics is available 48-96 hours after online publication and is updated daily on week days.
Initial download of the metrics may take a while.