Fig. 20.
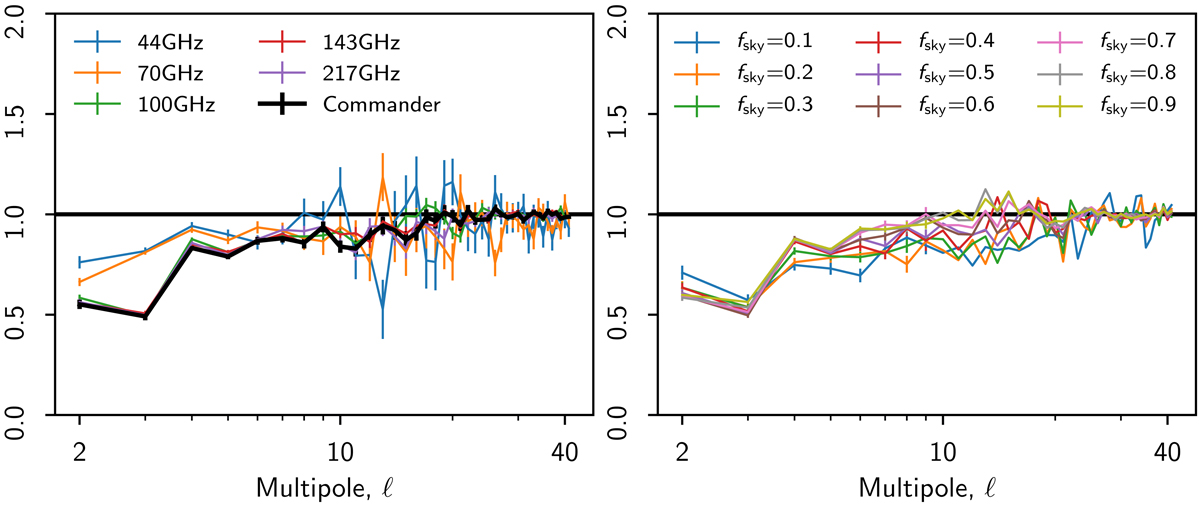
NPIPE E-mode transfer functions measured by comparing simulated CMB input and foreground-cleaned output maps. Left: CMB frequencies and component-separated Commander maps (Sect. 7) over 60% of the sky. The apparent mismatch between the LFI and HFI transfer functions results from the quantity and structure of the template corrections; templates that are specific to HFI, especially the ADC distortion, provide more degrees of freedom to suppress the CMB power. The 44 GHz transfer function is closer to unity because the 30 GHz template shields about 22% of the CMB polarization. The error bars reflect the statistical uncertainty of the measured transfer function, not the total Monte Carlo scatter. Tabulated values of the transfer functions are listed in Table G.1. Right: E-mode transfer function for 100 GHz over multiple sky fractions. The error bars at ℓ ≥ 10 were suppressed to show more structure.
Current usage metrics show cumulative count of Article Views (full-text article views including HTML views, PDF and ePub downloads, according to the available data) and Abstracts Views on Vision4Press platform.
Data correspond to usage on the plateform after 2015. The current usage metrics is available 48-96 hours after online publication and is updated daily on week days.
Initial download of the metrics may take a while.