Fig. 10.
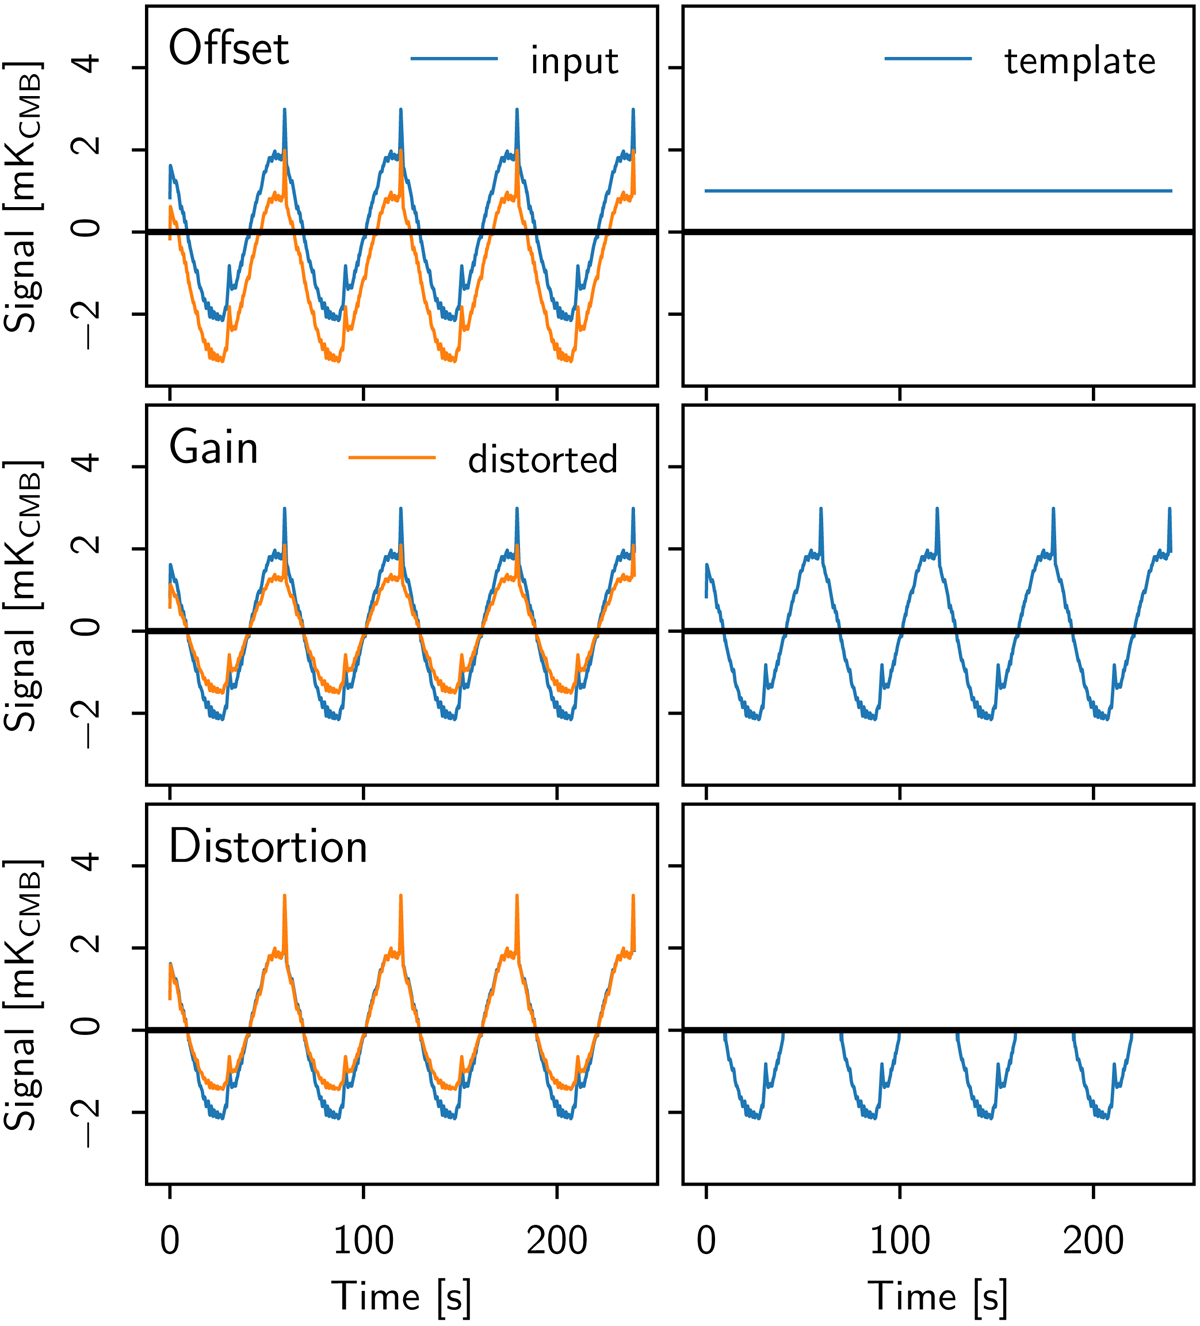
Three degrees of signal distortion due to HFI ADC nonlinearity (left panels) and the NPIPE templates used to fit for them (right panels). The blue curves give an interval of data from a specific bolometer. The main variations seen come from the detector scanning across the dipole and the Galactic plane, including the ADCNL effects. The orange curves show the steps taken to fit the distortions. Top: (harmless) signal offset is captured by destriping baselines (i.e., moving the orange curve upwards). Middle: linear gain fluctuations are addressed by calibration. Bottom: linear gain varies as a function of signal level and requires a separate gain template for the opposite ends of the signal range. This correction is unique to NPIPE.
Current usage metrics show cumulative count of Article Views (full-text article views including HTML views, PDF and ePub downloads, according to the available data) and Abstracts Views on Vision4Press platform.
Data correspond to usage on the plateform after 2015. The current usage metrics is available 48-96 hours after online publication and is updated daily on week days.
Initial download of the metrics may take a while.