Fig. 2.
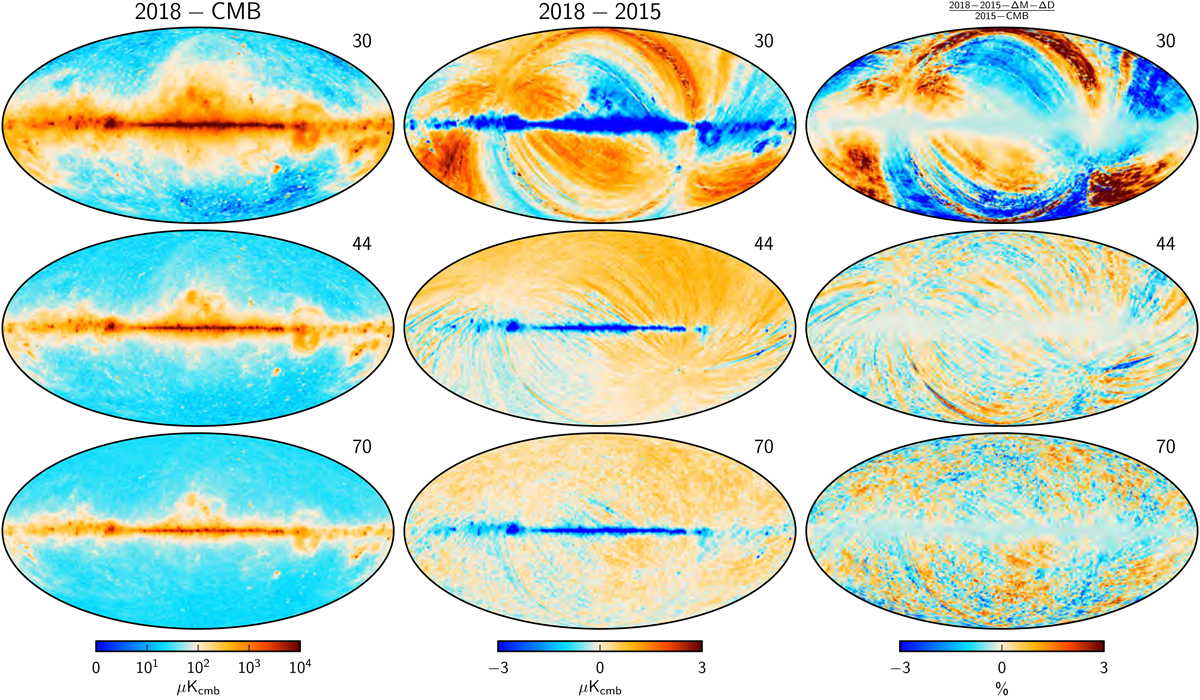
Comparison of 2018 and 2015 LFI temperature maps. From left to right columns: (1) difference between the 2018 intensity maps and the 2018 Commander CMB map; (2) difference between the 2018 and 2015 frequency maps; and (3) fractional difference between the 2018 and 2015 frequency maps. Note the different temperature scales. In the third column, ΔM and ΔD denote the relative monopole and dipole differences between the 2018 and 2015 sky maps. Rows indicate results for each of the three LFI frequency channels. All maps are smoothed to a common resolution of 1° FWHM.
Current usage metrics show cumulative count of Article Views (full-text article views including HTML views, PDF and ePub downloads, according to the available data) and Abstracts Views on Vision4Press platform.
Data correspond to usage on the plateform after 2015. The current usage metrics is available 48-96 hours after online publication and is updated daily on week days.
Initial download of the metrics may take a while.