Fig. A.1.
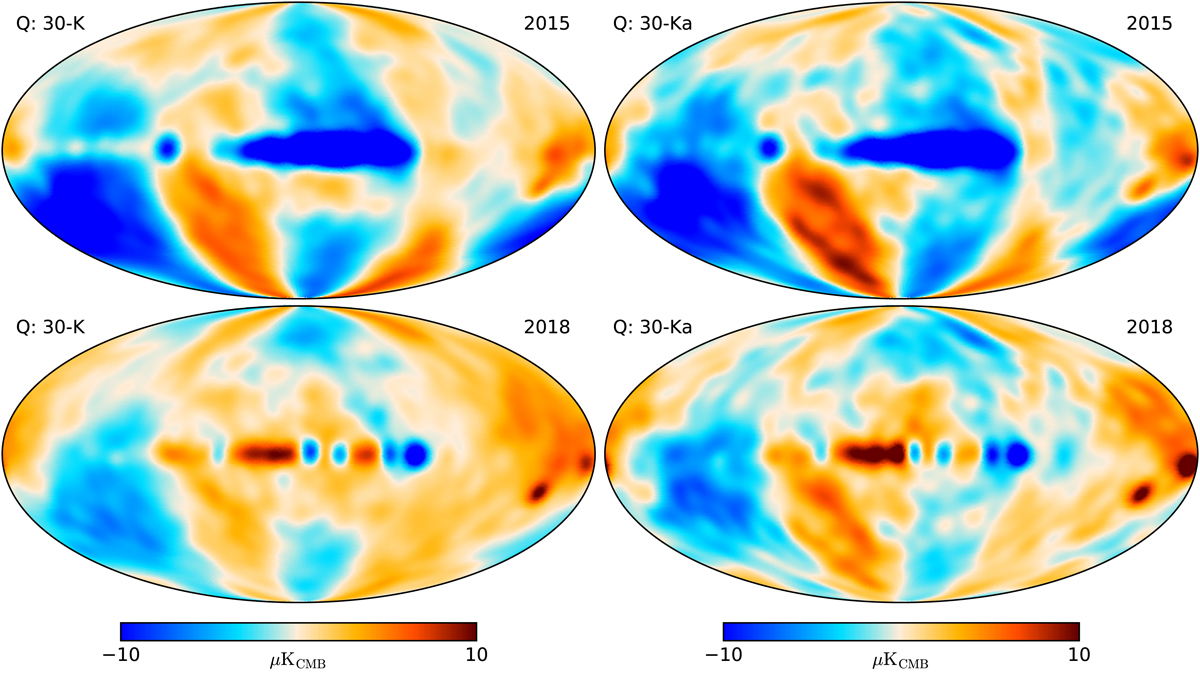
Stokes Q difference maps between Planck 30 GHz 2015 (top) and 2018 (bottom) and WMAP K-band (left) and Ka-band (right). The WMAP K and Ka band maps are rescaled to match the Planck 30 GHz effective frequency assuming synchrotron emission with a spectral index of −3. All maps used in this comparison have been smoothed with a 10 deg Gaussian beam.
Current usage metrics show cumulative count of Article Views (full-text article views including HTML views, PDF and ePub downloads, according to the available data) and Abstracts Views on Vision4Press platform.
Data correspond to usage on the plateform after 2015. The current usage metrics is available 48-96 hours after online publication and is updated daily on week days.
Initial download of the metrics may take a while.