Free Access
Fig. 15.
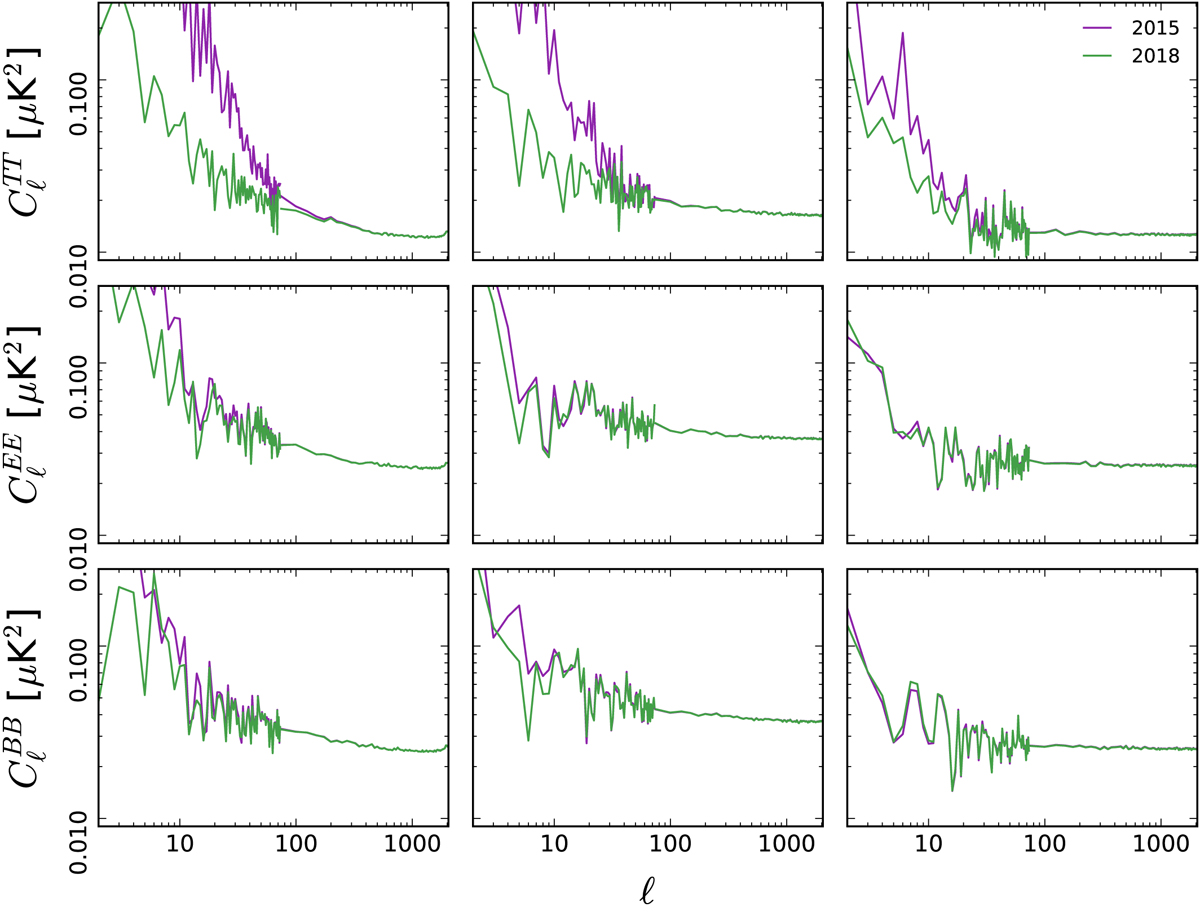
Angular pseudo-power spectra of the odd-even survey difference maps for 30 (left column), 44 (middle column), and 70 GHz (right column), with the 2015 data in purple and 2018 in green.
Current usage metrics show cumulative count of Article Views (full-text article views including HTML views, PDF and ePub downloads, according to the available data) and Abstracts Views on Vision4Press platform.
Data correspond to usage on the plateform after 2015. The current usage metrics is available 48-96 hours after online publication and is updated daily on week days.
Initial download of the metrics may take a while.