| Issue |
A&A
Volume 640, August 2020
|
|
|---|---|---|
| Article Number | A53 | |
| Number of page(s) | 9 | |
| Section | Astrophysical processes | |
| DOI | https://doi.org/10.1051/0004-6361/202038023 | |
| Published online | 10 August 2020 | |
Saturation mechanism and generated viscosity in gravito-turbulent accretion disks
1
Physics Department of Bayreuth, Universitätsstraße 30, Bayreuth, Germany
e-mail: This email address is being protected from spambots. You need JavaScript enabled to view it.
2
Alfred Wegener Institute, Helmholtz Centre for Polar and Marine Research, Bremerhaven, Germany
Received:
25
March
2020
Accepted:
6
June
2020
Abstract
Here, we address the turbulent dynamics of the gravitational instability in accretion disks, retaining both radiative cooling and irradiation. Due to radiative cooling, the disk is unstable for all values of the Toomre parameter, and an accurate estimate of the maximum growth rate is derived analytically. A detailed study of the turbulent spectra shows a rapid decay with an azimuthal wave number stronger than ky−3, whereas the spectrum is more broad in the radial direction and shows a scaling in the range kx−3 to kx−2. The radial component of the radial velocity profile consists of a superposition of shocks of different heights, and is similar to that found in Burgers’ turbulence. Assuming saturation occurs through nonlinear wave steepening leading to shock formation, we developed a mixing-length model in which the typical length scale is related to the average radial distance between shocks. Furthermore, since the numerical simulations show that linear drive is necessary in order to sustain turbulence, we used the growth rate of the most unstable mode to estimate the typical timescale. The mixing-length model that was obtained agrees well with numerical simulations. The model gives an analytic expression for the turbulent viscosity as a function of the Toomre parameter and cooling time. It predicts that relevant values of α = 10−3 can be obtained in disks that have a Toomre parameter as high as Q ≈ 10.
Key words: accretion / accretion disks / protoplanetary disks / hydrodynamics / instabilities / turbulence
© ESO 2020
1. Introduction
Self-gravity in accretion disks can lead to gravitational instability (GI), which was originally studied in the context of galaxies (Toomre 1964; Lin & Shu 1964; Lynden-Bell & Kalnajs 1972), but is relevant also for accretion disks around young stellar objects and protoplanetary disks (YSOs; PPDs) (Gammie 2001; Kratter & Lodato 2016). The gravitational instability sets in when the Toomre parameter,
 (1)
(1)
is smaller than one (Q < 1) (Toomre 1964). Here, cs is the sound speed, Σ is the mass surface density, and κ is the epicyclic frequency, or the angular frequency (κ = Ω0) in the case of a Keplerian disk. The Toomre parameter expresses that a higher temperature (or equivalently a higher sound speed) will stabilize the disk, whereas a higher surface density (Σ) has a destabilizing effect (Kratter & Lodato 2016; Lin & Kratter 2016). Additional physics has been considered since the original derivation, and it has been shown that radiative cooling and viscosity can destabilize the disk for Q > 1 (Lin & Kratter 2016).
Numerical simulations have clarified some aspects of the nonlinear evolution of the gravitational instability. In the case of sufficiently fast cooling, fragmentation occurs (Johnson & Gammie 2003; Rice et al. 2003, 2005; Kratter & Murray-Clay 2011; Booth & Clarke 2019), which may be relevant for the formation of massive exoplanets. If the cooling is less efficient, a gravito-turbulent state is obtained, in which the radiation losses are compensated by the heating of the disk through dissipation in shocks (Gammie 2001; Kratter & Lodato 2016). Hence, cooling strongly effects the nonlinear saturation of the gravitational instability (Cossins et al. 2009), and different implementations of the cooling prescription have been tested. These include the so-called β cooling prescription (Gammie 2001), an irradiated version of this latter model (Rice et al. 2011; Baehr & Klahr 2015), and also the solution of the full radiative transfer problem (Hirose & Shi 2019).
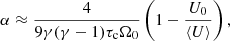
One major quality of gravito-turbulence is its ability to transport angular momentum, leading to accretion. A common measure for the angular momentum transport through turbulence is the α-parameter (Shakura & Sunyaev 1973). In a stationary state, the turbulent dissipation connected with the effective viscosity described by the α parameter is then balanced by the energy loss through radiation (⟨U⟩/τc, where τc is the cooling timescale on which the thermal energy is lost), yielding (Gammie 2001; Rice et al. 2011)
 (2)
(2)
where γ is the adiabatic index, U0 the stationary energy density obtained in the absence of turbulence through the combination of irradiation and radiation loss, and ⟨U⟩ is the averaged energy density in the presence of turbulence. Although the relation above is a powerful restriction on α, it does not allow a direct prediction because the averaged energy density ⟨U⟩ is not a priori known. As  , a prediction of α is possible when the Toomre parameter of the saturated turbulent state (⟨Q⟩) is known. It is generally accepted that saturation occurs close to marginal stability ⟨Q⟩ ≈ 1 (Kratter & Lodato 2016). However, simulations suggest saturated values higher than one (1 ≲ ⟨Q⟩ ≲ 2) (Rice et al. 2011; Vanon 2018), and those are often associated to the effects of nonaxisymmetric instabilities (Kratter & Lodato 2016; Vanon & Ogilvie 2016; Vanon 2018).
The goal of this paper is to study the nonlinear gravito-turbulent state, and to develop an analytic prediction for ⟨Q⟩ and α in the case of an irradiated disk. In Sect. 2 the basic model equations and assumptions used for the study are outlined. Section 3 presents a linear stability analysis, and Sect. 4 gives a short overview of the numerical tool DiskFlow including certain benchmarks. Section 5 analyses the nonlinear state, after which the analytic model based on a mixing length approach is introduced in Sect. 6. Section 7 derives some predictions of the analytic model, and conclusions are drawn in Sect. 8.
2. The model
The evolution of the disk is described with the local two-dimensional shearing sheet approximation (Goldreich & Lynden-Bell 1965; Balbus & Hawley 1998; Gammie 2001). The model equations consist of the continuity equation, Euler’s equation, the evolution equation for the internal energy density (U), and a Poisson equation for the gravitational potential (Φ) due to the mass density in the disk:
 (3a)
(3a)
 (3b)
(3b)
 (3c)
(3c)
 (3d)
(3d)
In the equations above, v is the fluid velocity, G is the gravitational constant, and P is the pressure, with the latter linked to the internal energy density (U) through the equation of state
 (4)
(4)
The shearing box coordinates (x, y) used in the equations above represent the radial x and azimuthal y direction. The forces per unit mass on the right hand side of the Euler equation, Eq. (3b), include the pressure gradient and the Coriolis, tidal, and self-gravitational forces in that order. The equilibrium is given by a uniform surface mass density (Σ0) and uniform internal energy density (U0). This equilibrium incorporates the shear in the Keplerian velocity profile v0 = −3Ω0xey/2, which develops through a balance of the Coriolis (−2Ω0 × v)) and tidal ( ) force.
For consistency with the literature (e.g., Gammie 2001) the adiabatic index is chosen as γ = 2, which agrees with the two-dimensional nature of the system. A model equation for the internal energy rather than an adiabatic closing relation for the pressure (P = const. ⋅ Σγ) is necessary, because the β-cooling prescription to mimic the loss of thermal energy due to radiation (Gammie 2001) is applied. Therein, β = τcΩ0 is the dimensionless cooling timescale. The cooling term incorporates a fiducial thermal energy density, U0, that the system would obtain in the absence of turbulence. Here, U0 is motived by the irradiation of the disk by the young star (see e.g., Rice et al. 2011), which, in combination with the radiation losses from the disk, leads to a floor in the thermal energy density.
The equilibrium values Σ0 and U0 also define initial values for the Toomre parameter (Q0) and sound speed cs,0, defined as
 (5)
(5)
3. Linear stability in the presence of cooling
The Toomre stability criterion Q > 1 was derived assuming the gas behaves adiabatically or barotropically, and expresses the fact that the gas pressure has a stabilizing effect. It is therefore natural to assume that radiative cooling leads to further destabilization and indeed this has been found (see e.g., Lin & Kratter 2016). As the linear instability plays a role for the nonlinear saturated state, it is investigated in some detail in this section.
The model equations of the previous section are linearised around the equilibrium (Σ0, U0, v0 = −(3/2)Ω0xey),Φ = 0,
 (6a)
(6a)
 (6b)
(6b)
 (6c)
(6c)
 (6d)
(6d)
whereby the tilde denotes a perturbed quantity. Neglecting all quadratic terms in the perturbations then gives a set of equations for the evolution of the perturbations:
 (7a)
(7a)
 (7b)
(7b)
 (7c)
(7c)
 (7d)
(7d)
where the perturbations have been assumed to be axisymmetric. Substituting  for all perturbed quantities (f) yields a set of algebraic equations from which the dispersion relation is obtained:
 (8)
(8)
The dispersion relation is similar to that found by Lin & Kratter (2016). Solutions for the growth rate as function of the wave vector for different values of Q0 and a normalized cooling time, β ≡ τcΩ0 = 10, are shown in Fig. 1.
 |
Fig. 1. Linear growth rate g as a function of the radial wave number kx for different equilibrium Toomre values Q0 and a cooling time β = τcΩ0 = 10. The straight dotted line gives the damping rate in numerical simulations (∝k2) for a damping coefficient D(2) = 0.1 (see Sect. 4). |
Taking the limit β = τcΩ0 → ∞ fully recovers the classical Toomre case with the known stability limit Q0 > 1. However, for finite β it follows from the dispersion relation that unstable modes occur for all values of Q0. The k domain is divided into two regions, with instability only occurring for k > Q0/2 as larger structures (smaller wave numbers) are stabilized by the Coriolis force. One might expect large wave numbers (small structures) to be stabilized as well because the critical Jeans mass cannot be met. However, the cooling extracts the excess thermal energy that is generated by the compression of the fluid, and exponential growth is obtained on timescales that are sufficiently long for this cooling to be effective. This is expressed in Eq. (8) through the occurrence of τcg in the stabilizing term connected with the pressure response. Therefore, the observation that the value of the Toomre parameter of the saturated turbulent state is larger than one (⟨Q⟩ > 1) does not imply linear stability. Although, it should be mentioned that the instability for Q0 might sensitively depend on the exact choice of the cooling model (see Lin & Kratter 2016, and the discussion in Sect. 7).
The fastest growing mode can be obtained by taking the partial derivative of the dispersion relation towards k and setting ∂g/∂k = 0 to obtain
 (9)
(9)
Substituting this back into Eq. (8) leads to a cubic polynomial in g only
 (10)
(10)
Solutions of this equation are shown as solid lines in Fig. 2 for cooling times β ∈ {6, 10, 100, ∞}. The last case (β → ∞) is the classical Toomre criterion without cooling. The analytic expression of the solution g(k) is somewhat extensive, but here the interest is mostly for cases with Q0 > 1 for which the growth rate is relatively small. In this case, the first term in Eq. (10) can be neglected against the second, and one readily obtains
 (11)
(11)
 |
Fig. 2. Analytically obtained growth rates of the most unstable modes, depicted as solid lines. The symbols °, ×, and ⋄ correspond to simulations with β = τcΩ0 = 6, 10 and no cooling respectively. The classical Toomre case (no cooling) prevents stability for Q0 > 1. The cooled cases are unstable for all Q0. |
where the maximum wave vector is obtained by inserting the estimate for the growth rate in Eq. (9). The result of Eq. (11) is relatively simple and therefore an easy-to-use estimate of the growth rate that works well for Q ≳ 1.2. The wave vector is surprising as one usually finds kcs0/Ω0 = 1/Q0 according to the classical Toomre criterion in the absence of cooling. The latter is equivalent to a Jeans criterion, stating that for smaller mass densities (larger Q0) one needs a larger volume (size ∝1/k) to reach the critical mass. In fact, the result in Eq. (11) is assumed to hold for small g. It turns out that for gβ >> 1 one actually finds kcs0/Ω0 = 1/Q0 as for the case without cooling. This backs up the above given interpretation that, for a given Q0, the growth rate is sufficiently small in comparison to 1/β to allow further collapse.
4. Code and benchmarking
The simulations presented here use the code DiskFlow1 which is a grid-based finite-difference code. The equations solved are the two-dimensional compressible fluid equations outlined above. The fluid equations are integrated using a fourth-order Runge-Kutta method. DiskFlow assumes shearing periodic boundary conditions, with the box being periodic in azimuthal y-direction and sheared periodic in the radial x-direction (see e.g., Balbus & Hawley 1998). The Poisson equation for self-gravity is solved using a Fourier transform (Gammie 2001). At each time-step the surface density Σ is transformed to Fourier space  , and the Fourier amplitude of the gravitational potential (
 ) is updated through
 (12)
(12)
where k := |k| and k = (kx, ky) is the two-dimensional wave vector. The gravitational potential in real space is then obtained through a backward transformation. To avoid difficulties with the Fourier transform in combination with the shearing periodic boundary conditions, a back mapping of the surface mass density, undoing the effect of the shearing and ensuring the solution is periodic in both directions, is performed before the Fourier transform is calculated. Furthermore, a cut-off wave vector  is introduced, following (Gammie 2001). The cut-off acts as a smoothing factor for small-scale gravity. Although this is possibly problematic for cases with clumping (see e.g., Young & Clarke 2015) it has been shown to work well for the gravito-turbulent state.
An artificial viscous pressure is included in DiskFlow to guarantee numerical stability
 (13)
(13)
This artificial viscous pressure is especially useful in the case of shocks (see e.g., Gammie 2001), as it acts as a viscosity that responds to volumetric changes in the fluid. Moreover, it does not extract energy from the system, as the dissipated kinetic energy is consistently transferred to thermal energy. For the simulations shown here, ζ = 0.006 is chosen.
The code also provides the possibility of using artificial viscosity, which is implemented as a second-order diffusion scheme. More precisely, all of the Eqs. (3a)–(3b) contain an additional dissipative term (second spatial derivatives):
 (14)
(14)
with a damping coefficient D(2) and resolution △x = L/N. Typical values used for the simulations are D(2) ∼ {0.07−0.8}. Empirically, it is found that D(2) ≤ 0.1 is problematic as small-scale perturbations cannot be damped sufficiently and the simulation might eventually become numerically unstable. The coefficient D(2) is made variable in time in order to capture the violent transition from the linear growth phase to the nonlinearly saturated state. In this latter state, the damping coefficient is kept as low as possible. By construction, the damping predominantly acts on small scales (i.e., roughly grid-scale).
All quantities have been made dimensionless using the angular frequency (Ω0), the sound speed at initialisation (cs0), and the gravitational constant G. With this choice the surface mass density is normalized with Σch = cs, 0Ω0/G, the internal energy density with  , and the gravitational potential with
  . Furthermore, the characteristic length scale Lch = cs, 0/Ω0 is equal to the disk scale height, Lch = H, that would be obtained if the vertical force balance were considered. Timescales are normalized with the characteristic time
  , which is consistent with the dimensionless cooling parameter, β ≡ τcΩ0, used before. Unless stated otherwise, all quantities below are dimensionless.
As one of the code benchmarks, the growth rate of the most unstable mode is calculated as a function of the Toomre parameter (Q0) for different normalized cooling times (β). The numerical results, shown in Fig. 2, are in excellent agreement with the analytic formula obtained in Sect. 3. The simulations use a box size comparable to the analytically derived wavelength of the fastest growing mode and are initialised with random density perturbations. The growth rates are then determined for an interval of exponential growth t1 < t < t2, using
 (15)
(15)
Figure 3 shows that a stationary turbulent state is obtained in the simulations and gives the time evolution of the box-averaged perturbed kinetic, gravitational, and thermal energy densities:
 (16)
(16)
 |
Fig. 3. Temporal evolution of the averaged perturbed energy densities for a simulation with Q0 = 1 and β = 10. Shown are the mean thermal energy density Eth, the mean kinetic energy density Ekin, and the mean gravitational potential energy density Egrav, as defined in Eq. (16). |
The corresponding simulation parameters are specified in Table 1. The corresponding surface density Σ(x, y) and radial velocity vx(x, y) at t = 200 for this simulation are shown in Figs. 4 and 5, respectively. As can be inferred from the images, the system is subject to shock formation. The shocks provide the mechanism for dissipating kinetic energy and to increase the thermal energy which is then lost through radiative cooling.
 |
Fig. 4. Snapshot of the surface density Σ(x, y) at time t = 200 for a simulation with Q0 = 1 and β = 10. |
 |
Fig. 5. Snapshot of the radial velocity vx(x, y) at time t = 200 for a simulation with Q0 = 1 and β = 10. |
Specifications of the example simulation.
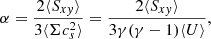
The α parameter is directly linked to the xy-component of the total stress (Sxy). Here, the definition of Ref. (Gammie 2001) is used
 (17)
(17)
where the average ⟨…⟩ is over both the simulation domain and time. The total stress consists of the Reynolds and Gravitational stress  , with
 (18)
(18)
(For a derivation of the gravitational stress, see e.g., Lynden-Bell & Kalnajs 1972). A stringent benchmark for the nonlinear saturated stated is then provided by Eq. (2), which links α to the averaged internal energy ⟨U⟩, which can be directly measured in the simulations. The two methods are compared in Fig. 6, which shows that they agree very well. As Eq. (2) is derived from energy conservation, the agreement between the two methods of determining α shows that energy conservation is adequately satisfied numerically.
 |
Fig. 6. α-values obtained via two different approaches. Values of α directly obtained from the simulations via averaging of the stresses over both the box and time, according to Eq. (17) (⋄). The values of α were obtained via Eq. (2) (×). All simulations use β = 10 and the sizes of time averaging intervals are chosen in the range 100−400. |
5. Nonlinear state
To better understand the nature of the gravito-turbulent state, in this section, the nonlinear saturated state is investigated in some detail. Important insights can be obtained through the study of the power spectra in Fourier space. The power spectrum of the perturbed mass surface density  , where
  is the Fourier amplitude, is shown in Fig. 7 as a function of the wave vector k = (kx, ky). This spectrum is obtained by averaging over a time interval of Δt = 400 of the fully developed turbulent state. The parameters of the simulation are: Q0 = 2.2 and β = 10, and a 512 × 512 grid is used with box sizes Lx = Ly = 20. Although the surface mass density spectrum is shown here, the spectrum of the kinetic energy is qualitatively similar.
 |
Fig. 7. Two-dimensional power spectrum of the surface density ℰk(kx, ky) for the case Q0 = 2.2, β = 10, Lx = Ly = 20, N = 512. The image was obtained by averaging all time-snapshots over an interval of orbits △t = 400. |
As can be seen in Fig. 7, the spectrum is not isotropic in the (kx, ky) plane. Contours of constant intensity are tilted ellipses, with the spectrum being more extended in the x- than in the y-direction. A similar result has been found Lesur & Longaretti (2011), Mamatsashvili et al. (2014), and Gogichaishvili et al. (2017) for the case of magnetohydrodynamic turbulence. The anisotropy can be explained through the equilibrium flow which sets a unique direction to the system. More specifically, due to the equilibrium shear flow, each structure with a finite ky develops ever smaller wavelengths in the x-direction or, in other words, the x-component of the wave vector (kx) is time dependent,
 (19)
(19)
(see e.g., Lesur & Longaretti 2011; Goldreich & Lynden-Bell 1965). It has been shown for the case of incompressible magnetohydrodynamic turbulence that the shearing can lead to an anomalous energy transfer in Fourier space in the direction of larger radial wave vectors (Lesur & Longaretti 2011).
In order to study the dependency on kx (ky), the spectra are projected onto the kx (ky) axis by integrating over ky (kx)
 (20)
(20)
Depicted in Fig. 8 are the 𝒫x-projections of the power spectra for the kinetic energy density per mass  and the surface density
  , for both Q0 = 1.2 and Q0 = 2.4. As expected, the turbulent intensity drops with increasing Q0. However, the qualitative shape of the spectrum remains unaltered. The spectra appear to obey a scaling law for the range of radial wave numbers 3 ≲ kx ≲ 30. Depending on whether one studies the surface density or the kinetic energy density per mass, the scaling is between k−2 and k−3, as can be seen in Fig. 8. The 𝒫y projection is shown for comparison in Fig. 9 for an initial Toomre parameter Q0 = 2.0. It can be seen that the projection 𝒫y drops significantly faster with increasing ky than 𝒫x with increasing kx. The anisotropy therefore increases with increasing wave vectors (we note that the small-scale behavior might differ from that in case of a three-dimensional system (Riols et al. 2017; Booth & Clarke 2019). Furthermore, in contrast to 𝒫x it is not obvious that 𝒫y obeys a scaling law.
 |
Fig. 8. Projections 𝒫x of the two-dimensional power spectra onto the kx-axis for |


 |
Fig. 9. Projections 𝒫x and 𝒫y of the kinetic energy per mass power spectrum onto the kx and ky-axis respectively. As can be observed, the 𝒫y-projection drops significantly faster than the 𝒫x-projection. The spectra are shown for Q0 = 2.0. |
As the scaling of the x-projections is close to k−3, it is tempting to connect the scaling with the enstrophy cascade of two-dimensional incompressible turbulence (see e.g., Boffetta & Ecke 2012). However, the velocity field of the gravito-turbulence is not incompressible, and in combination with the nonadiabatic response, neither enstrophy nor potential vorticity are conserved. Furthermore, the turbulence is strongly anisotropic. The strong decay of 𝒫yℰk with ky (stronger than k−3) shows that there is no strong cascade in the y-direction. This, together with the increasing anisotropy of the turbulence with increasing wave vector, shows that the velocity nonlinearity, although important, does not completely dominate the dynamics. The gravito-turbulent state is consequently not a strongly turbulent system. At the wave vectors where dissipation becomes important (which can be seen from the change in slope of the spectrum), the energy in the ky modes is negligible compared to the energy in the kx modes, and kinetic energy is transferred to internal energy through the dynamics in the radial direction. The wider spectrum in the radial direction is partly due to the shearing that leads to a temporal increase in the radial wave vector given by Eq. (19). However, the scaling of 𝒫xℰk with kx is not entirely consistent with the steep decrease in 𝒫yℰk with ky, when only shearing over a fixed time interval is considered. Additional physics is therefore expected to further broaden the spectrum in the radial direction.
Further insights can be drawn by investigating the radial velocity profiles. Depicted in Fig. 10 is a slice y = 0 of the radial velocity vx(x, y = 0) from a simulation with Q0 = 2.8. The radial velocity in the turbulent state consists of a chaotic superposition of several shocks, where the velocity is discontinuous. These shocks have different widths and heights, and are almost axisymmetric, as can be seen from Fig. 5, reflecting the strong anisotropy in the spectrum. We note that, although the velocity is of the order of the sound speed (i.e., of the order of 1 due to the normalization to the sound speed), almost all the shocks have a step in velocity smaller than the sound speed. Furthermore, at smaller Q0 the steps are larger and can considerably exceed the sound speed. The shocks that form are not directly due to the Mach number exceeding one in the frame of the computational grid.
 |
Fig. 10. Slice (y = 0) for the radial velocity vx of a simulation with Q0 = 2.8, β = 10. One characteristic of the radial velocity snapshots is the appearance of shocks or velocity discontinuities. |
The radial profile of the radial velocity is in agreement with the nonlinear wave steepening obtained in Burgers’ turbulence (see e.g., Bec & Khanin 2007):
 (21)
(21)
An initially unstable sine profile of the radial velocity, vx = v0 sin(kx x), develops through the nonlinearity with the two adjacent maxima (positive and negative) approaching each other and eventually coalescing. In this process, the original sine profile will change its morphology to a structure similar to those seen in the small image in Fig. 11.
 |
Fig. 11. Comparison of the power spectrum for a single shock |


Taking the shock to have a generic form,
 (22)
(22)
the Fourier transform can be shown to be
 (23)
(23)
Therefore, the Fourier spectrum of the shock depicted in Fig. 11 scales as
 (24)
(24)
where f modulates the k−2 scaling. As the power spectra suggest, most of the energy resides in modes with kx ≈ 1. Hence, one might use a width of the shock λ = 2π/k ≈ 2π. The power spectrum of the shock with this assumption is shown in Fig. 11. The shock spectrum has been scaled vertically for better comparison with the spectra obtained from the simulations. The shock shows a k−2 law and the nonlinear spectra of the turbulent state differ only slightly from that scaling. It is noted here that the k−2-scaling is relatively independent of the actual shock width λ and height μ and therefore a chaotic superposition of shocks does not qualitatively alter the appearance of the spectra. Deviations between the shock spectrum and the simulated spectra occur for large values of kx, suggesting that the deviations are likely due to the artificial viscosity which dominates at larger wave vectors.
The picture that emerges from the studies presented in this section is that the velocity nonlinearity mainly leads to wave steepening in the radial direction. The process continues until a shock forms, with the small radial length scales associated with the shock allowing for efficient dissipation. Modes that are initially growing saturate through the dissipation that occurs when shocks are present.
6. Analytic model
In this section, we develop an analytic model that predicts α for the gravito-turbulent state of an irradiated disk. The model combines a mixing length approach with elements from linear theory. Using the definition of α provided in Eq. (17), and linking the stress to the turbulent viscosity (νt) yields
 (25)
(25)
where a Keplerian velocity profile in the local approximation ∂⟨vy⟩/∂x = −3/2 is used. The kinematic viscosity of the nonlinear state can be estimated using a mixing length approach Shakura (2018). Consider the two dimensional (x, y) shear flow in the local shearing box approximation. A turbulent velocity  will move a fluid parcel in the radial direction over a distance δx, with the parcel keeping its original y-component of the velocity vy. Hence, the y-velocity perturbation δvy is (see Shakura 2018)
 (26)
(26)
The averaging brackets ⟨…⟩ are assumed to be spatial and temporal averages (more technically, one can also assume them to be ensemble averages, see e.g., Shakura 2018). Using the equation above in the stress yields
 (27)
(27)
and comparison with equation (25) then gives the mixing length estimate of the kinematic viscosity
 (28)
(28)
where in the second step the radial velocity is expressed through a typical timescale of vx = δx/δt.
In order to predict α, Eq. (2) is used to eliminate ⟨U⟩ in Eq. (17), yielding
 (29)
(29)
Subsequently, expressing the stress in the kinematic viscosity using Eq. (25), gives
 (30)
(30)
whereby α0 ≡ 4/(9γ(γ − 1)β) is used for the last step. We would like to point out that νt ≠ α, as ν is normalized with the background sound speed cs, 0 rather than saturated speed of sound ⟨cs⟩. Using the mixing length model for νt in the equation above gives an expression for α.
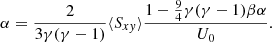
As discussed in Sect. 5, saturation occurs through the nonlinear steepening of radial waves. Since the maximum (minimum) of the wave has to move over roughly a quarter wavelength to generate the observed shock structures, the mixing length can be taken to be a quarter wavelength of the dominant radial mode:
 (31)
(31)
The spectra of the nonlinear state decrease in amplitude with increasing Q0, but the functional dependence on kx remains nearly unaltered. Therefore, the typical wave vector appearing in the mixing length estimate is relatively nonsensitive to the Q0 value, and a typical value can be obtained by averaging over the spectrum:
 (32)
(32)
This procedure yields
 (33)
(33)
as a typical value for  . It then follows that
  , which fits with the average distance between two shock fronts in Fig. 5, and agrees with the results of previous work (e.g., Kratter & Lodato 2016; Cossins et al. 2009) showing that dissipation occurs at wave numbers
  through sonic shocks.
The typical timescale can be argued to be linked to the growth rate. Although, for many turbulent systems, linear theory is not particularly relevant, we show in the previous section that the nonlinear state of the gravito-turbulence is not strongly turbulent. The relevance of linear theory can be further justified by the following observations.
-
There must be a mechanism providing an ongoing exchange of energy from the background (shear flow) to the actual turbulent motion of the fluid. A linear instability is a candidate for this mechanism. Indeed, the strength of turbulence drops with increasing values of Q0 as can be seen in Fig. 8 in agreement with the dependence of the linear growth rate g on Q0.
-
The relevance of linear theory for the nonlinear state can be further assessed by investigating cases close to the threshold of the linear instability. With radiative cooling, the disk is analytically unstable for all values of the Toomre parameter. However, due to the added dissipation, this is not necessarily the case in the numerical simulations. This is illustrated in Fig. 6, where it can be seen that for Q0 > 3 the disk is stable when a diffusion coefficient D(2) = 0.1 is used. Indeed, numerical simulations with Q0 > 3.2 (D(2) = 0.1) show no turbulent state even when initialised with a turbulent state obtained for Q0 < 3. Although there is a window in Q0 where turbulence can be maintained despite linear stability, at least for some time, this window is small. Therefore, in summary, the development of gravito-turbulence requires a linear instability to be present.
The relevance of the linear drive suggests that the growth rate plays a role in the determination of the typical timescale. Consequently  is used as the typical inverse timescale. Using that and Eq. (33), one finds an analytical expression for the turbulent kinematic viscosity:
 (34)
(34)
We note that something similar is often used in fusion plasma physics in the context of turbulent transport (Weiland 2016).
The analytic result of Eq. (34) can subsequently be used to predict α according to Eq. (30). Indeed, g depends on both the Toomre parameter Q and the cooling timescale β.
7. Predictions of the analytic model
Analytic linear growth rates were obtained for an equilibrium without turbulence and are therefore a function of Q0. The saturated Toomre parameter of the turbulent state ⟨Q⟩, with ⟨...⟩ denoting averages over the computational domain as well as time, is found to be larger than one and close to ⟨Q⟩ ≈ 2 in two-dimensional systems (see e.g., Vanon 2018). The simulations of this paper confirm this observation but nevertheless show that saturation can occur at values considerably larger than 2, and that ⟨Q⟩ is a function of irradiation as well as cooling time. The turbulent saturation values obtained from the simulations are depicted as crosses in Fig. 12. The average was calculated in the following way:
 (35)
(35)
The relevant timescale in the mixing length model is set by the linear growth rate. However, the latter must describe the growth in the saturated turbulent state. Consequently, the growth rate must be considered a function of ⟨Q⟩ and  .
.
As ⟨Q⟩ > 1, the approximate growth rate from Eq. (11) is used and substituted into Eq. (34):
 (36)
(36)
where  is used. This latter equation relates α with ⟨Q⟩. The prediction is completed using Eq. (2), which provides a relation between α and ⟨U⟩ and consequently ⟨Q⟩ as well. For the purpose here, it is convenient to rewrite Eq. (2) in terms of νt
 (37)
(37)
where  is used. Hence, one can now predict both α and ⟨Q⟩ depending on the irradiation equilibrium Q0.
The prediction of ⟨Q⟩ as derived above is shown as the black solid line in Fig. 12. One conclusion that can be drawn directly from Eq. (37) is that ⟨Q⟩ > Q0 always holds. Furthermore, as g → 0 for ⟨Q⟩ → ∞, we conclude that ⟨Q⟩ → Q0 for Q0 → ∞ by considering Eq. (36). The prediction for α depending on Q0 is shown in Fig. 13.
 |
Fig. 12. Toomre parameter at turbulent saturation ⟨Q⟩ plotted as a function of irradiation equilibrium Q0. Crosses: values derived from simulations by averaging the turbulent state over both box and time according to Eq. (35). Solid line: analytical prediction via Eqs. (36) and (37). |
 |
Fig. 13. Comparison of the analytical mixing length prediction with the simulation data. Crosses: α values derived by averaging the simulation data over both box and time according to Eq. (17). Black curve: prediction from the mixing length argument in Eqs. (36) and (37). |
The predictions seem to fit the data well except for values of Q0 > 3.2. This discrepancy is due to the above-mentioned numerical damping, which prevents a turbulent state from being sustained as the linear driving is compromised. More precisely, the simulations for Q0 = 3.4 and 4.0 could not maintain a turbulent state. The corresponding values for α and ⟨Q⟩ are obtained by averaging the decaying turbulence, in the absence of a persistent nonlinear state.
We note that the analytic model predicts comparatively large α values for high background Toomre parameters Q0. To see that, one can approximate Eq. (30) assuming small growth rates,
 (38)
(38)
whereby ⟨Q⟩ ≈ Q0 for large Q0. Assuming β = 10, a relevant value α = 10−3 is obtained for ⟨Q⟩ ≈ 10, that is, an order of magnitude above the Toomre stability criterion. Of course, shorter cooling times lead to larger values of α at fixed ⟨Q⟩. However, shorter cooling may also lead to clumping (Johnson & Gammie 2003; Rice et al. 2003, 2005, 2011; Kratter & Murray-Clay 2011). The effects of clumping are beyond the scope of this work but a study of this effect at the higher values of ⟨Q⟩ obtained in this paper when compared with the literature is worthy of further study.
It is noted that the prediction of α > 10−3 for ⟨Q⟩ ≈ 10 is connected with the stability analysis in Sect. 3. The latter might depend on the cooling model that is applied. Here, the fiducial cooling level is a constant background thermal energy density U0. Alternatively, one can choose the reference cooling level to be density dependent, leading to a cooling term (Rice et al. 2011)
 (39)
(39)
Linearization leads to an additional term  (see e.g., Lin & Kratter 2016), when compared with the analysis of Sect. 3. This additional term has stabilizing effects as locally compressed areas are cooled less efficiently than locally expanding areas. Indeed, linear stability analysis reveals that the cooling model presented in Eq. (39) yields positive growth rates only for
  or in the case discussed here: Q0 ≲ 1.4. Nevertheless, the β-cooling description is a strong simplification and one could argue for both cooling models. To fully elucidate the problem, one would have to solve the full radiative transfer equation.
8. Conclusion
In this paper, the gravito-turbulent state of a razor-thin irradiated disk is studied in detail. We show that, depending on the cooling prescription, a linear instability occurs for all values of the equilibrium Toomre parameter Q0, and we derive an accurate analytic estimate of the maximum growth rate for Q0 > 1. A detailed study of the spectra reveals that the gravito-turbulent state is not strongly turbulent. The spectra are anisotropic with the anisotropy increasing with the wave vector. The spectra drop off rapidly with ky (stronger than  ) and show no clear power-law scaling with ky. This suggests that no cascade in the y-direction takes place and saturation is connected with dynamics in the radial direction. In contrast, the spectrum as a function of the radial wave vector does show a power law with a scaling in the range k−2 − k−3, which can be explained through the existence of shocks. The radial velocity profile as a function of the radial coordinate is consistent with Burgers’ turbulence, consisting of several shocks of different height. The observations suggest that linearly unstable modes grow in amplitude until the nonlinearity is strong enough, leading to wave steepening and shock formation. The small radial scales connected with the shock then allow for efficient dissipation and, consequently, saturation of the mode.
Using these observations, a mixing length model is developed using a quarter wave length as the radial step length and the growth rate of the most unstable mode as the typical time. This model gives an analytic prediction of the viscosity parameter α as a function of the Toomre parameter and cooling time, and it compares very well with the numerical simulations. The model predicts relevant values of α = 10−3 for Toomre parameters an order of magnitude larger than the original Toomre limit (i.e., ⟨Q⟩ ≈ 10). It is noted that this result can change when using a different cooling description and more accurate models with radiative transfer would be useful here.
For more details as well as the source code see https://bitbucket.org/astro_bayreuth/accretion-disk-flow/src/master/
References
- Baehr, H., & Klahr, H. 2015, ApJ, 814, 155 [Google Scholar]
- Balbus, S. A., & Hawley, J. F. 1998, Rev. Mod. Phys., 70, 1 [Google Scholar]
- Bec, J., & Khanin, K. 2007, Phys. Rep., 447, 1 [Google Scholar]
- Boffetta, G., & Ecke, R. E. 2012, Ann. Rev. Fluid Mech., 44, 427 [Google Scholar]
- Booth, R. A., & Clarke, C. J. 2019, MNRAS, 483, 3718 [Google Scholar]
- Cossins, P., Lodato, G., & Clarke, C. J. 2009, MNRAS, 393, 1157 [Google Scholar]
- Gammie, C. F. 2001, ApJ, 553, 174 [Google Scholar]
- Gogichaishvili, D., Mamatsashvili, G., Horton, W., Chagelishvili, G., & Bodo, G. 2017, ApJ, 845, 70 [Google Scholar]
- Goldreich, P., & Lynden-Bell, D. 1965, MNRAS, 130, 125 [NASA ADS] [CrossRef] [Google Scholar]
- Hirose, S., & Shi, J.-M. 2019, MNRAS, 485, 266 [Google Scholar]
- Johnson, B. M., & Gammie, C. F. 2003, ApJ, 597, 131 [Google Scholar]
- Kratter, K., & Lodato, G. 2016, ARA&A, 54, 271 [NASA ADS] [CrossRef] [Google Scholar]
- Kratter, K. M., & Murray-Clay, R. A. 2011, ApJ, 740, 1 [Google Scholar]
- Lesur, G., & Longaretti, P.-Y. 2011, A&A, 528, A17 [NASA ADS] [CrossRef] [EDP Sciences] [Google Scholar]
- Lin, C., & Shu, F. 1964, ApJ, 140, 646 [Google Scholar]
- Lin, M.-K., & Kratter, K. M. 2016, ApJ, 824, 91 [Google Scholar]
- Lynden-Bell, D., & Kalnajs, A. J. 1972, MNRAS, 157, 1 [Google Scholar]
- Mamatsashvili, G. R., Gogichaishvili, D. Z., Chagelishvili, G. D., & Horton, W. 2014, Phys. Rev. E, 89, 043101 [Google Scholar]
- Rice, W. K. M., Armitage, P. J., Bate, M. R., & Bonnell, I. A. 2003, MNRAS, 339, 1025 [Google Scholar]
- Rice, W. K. M., Lodato, G., & Armitage, P. J. 2005, MNRAS, 364, L56 [NASA ADS] [CrossRef] [Google Scholar]
- Rice, W. K. M., Armitage, P. J., Mamatsashvili, G. R., Lodato, G., & Clarke, C. J. 2011, MNRAS, 418, 1356 [Google Scholar]
- Riols, A., Latter, H., & Paardekooper, S.-J. 2017, MNRAS, 471, 317 [Google Scholar]
- Shakura, N. 2018, Accretion Flows in Astrophysics, Astrophys. Space Sci. Libr., 454 (Springer) [Google Scholar]
- Shakura, N. I., & Sunyaev, R. A. 1973, A&A, 24, 337 [NASA ADS] [Google Scholar]
- Toomre, A. 1964, ApJ, 139, 1217 [Google Scholar]
- Vanon, R. 2018, MNRAS, 477, 3683 [Google Scholar]
- Vanon, R., & Ogilvie, G. I. 2016, MNRAS, 463, 3725 [Google Scholar]
- Weiland, J. 2016, Plasma Phys. Rep., 42, 502 [Google Scholar]
- Young, M. D., & Clarke, C. J. 2015, MNRAS, 451, 3987 [Google Scholar]
All Tables
All Figures
|
Fig. 1. Linear growth rate g as a function of the radial wave number kx for different equilibrium Toomre values Q0 and a cooling time β = τcΩ0 = 10. The straight dotted line gives the damping rate in numerical simulations (∝k2) for a damping coefficient D(2) = 0.1 (see Sect. 4). |
| In the text | |
|
Fig. 2. Analytically obtained growth rates of the most unstable modes, depicted as solid lines. The symbols °, ×, and ⋄ correspond to simulations with β = τcΩ0 = 6, 10 and no cooling respectively. The classical Toomre case (no cooling) prevents stability for Q0 > 1. The cooled cases are unstable for all Q0. |
| In the text | |
|
Fig. 3. Temporal evolution of the averaged perturbed energy densities for a simulation with Q0 = 1 and β = 10. Shown are the mean thermal energy density Eth, the mean kinetic energy density Ekin, and the mean gravitational potential energy density Egrav, as defined in Eq. (16). |
| In the text | |
|
Fig. 4. Snapshot of the surface density Σ(x, y) at time t = 200 for a simulation with Q0 = 1 and β = 10. |
| In the text | |
|
Fig. 5. Snapshot of the radial velocity vx(x, y) at time t = 200 for a simulation with Q0 = 1 and β = 10. |
| In the text | |
|
Fig. 6. α-values obtained via two different approaches. Values of α directly obtained from the simulations via averaging of the stresses over both the box and time, according to Eq. (17) (⋄). The values of α were obtained via Eq. (2) (×). All simulations use β = 10 and the sizes of time averaging intervals are chosen in the range 100−400. |
| In the text | |
|
Fig. 7. Two-dimensional power spectrum of the surface density ℰk(kx, ky) for the case Q0 = 2.2, β = 10, Lx = Ly = 20, N = 512. The image was obtained by averaging all time-snapshots over an interval of orbits △t = 400. |
| In the text | |
|
Fig. 8. Projections 𝒫x of the two-dimensional power spectra onto the kx-axis for |
| In the text | |
|
Fig. 9. Projections 𝒫x and 𝒫y of the kinetic energy per mass power spectrum onto the kx and ky-axis respectively. As can be observed, the 𝒫y-projection drops significantly faster than the 𝒫x-projection. The spectra are shown for Q0 = 2.0. |
| In the text | |
|
Fig. 10. Slice (y = 0) for the radial velocity vx of a simulation with Q0 = 2.8, β = 10. One characteristic of the radial velocity snapshots is the appearance of shocks or velocity discontinuities. |
| In the text | |
|
Fig. 11. Comparison of the power spectrum for a single shock |
| In the text | |
|
Fig. 12. Toomre parameter at turbulent saturation ⟨Q⟩ plotted as a function of irradiation equilibrium Q0. Crosses: values derived from simulations by averaging the turbulent state over both box and time according to Eq. (35). Solid line: analytical prediction via Eqs. (36) and (37). |
| In the text | |
|
Fig. 13. Comparison of the analytical mixing length prediction with the simulation data. Crosses: α values derived by averaging the simulation data over both box and time according to Eq. (17). Black curve: prediction from the mixing length argument in Eqs. (36) and (37). |
| In the text | |
Current usage metrics show cumulative count of Article Views (full-text article views including HTML views, PDF and ePub downloads, according to the available data) and Abstracts Views on Vision4Press platform.
Data correspond to usage on the plateform after 2015. The current usage metrics is available 48-96 hours after online publication and is updated daily on week days.
Initial download of the metrics may take a while.