Fig. 6.
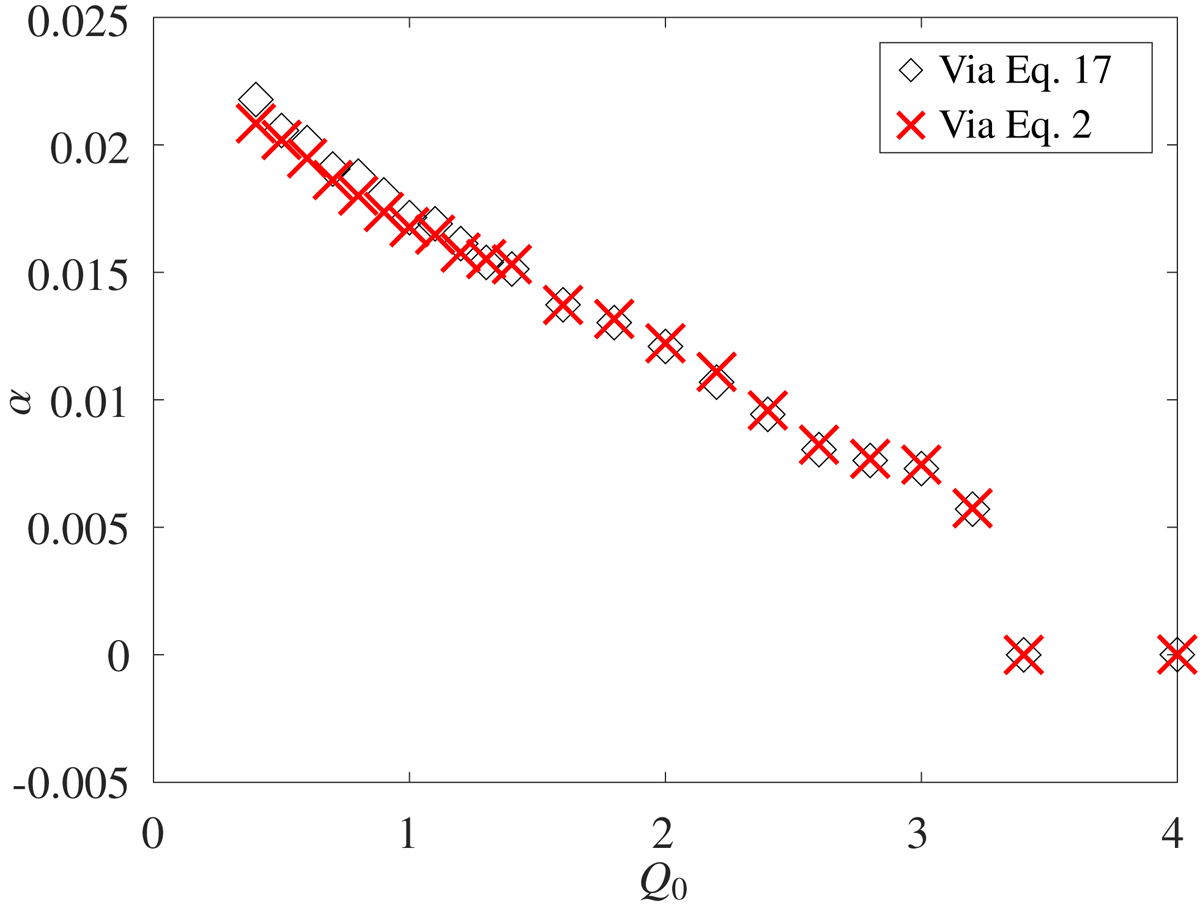
α-values obtained via two different approaches. Values of α directly obtained from the simulations via averaging of the stresses over both the box and time, according to Eq. (17) (⋄). The values of α were obtained via Eq. (2) (×). All simulations use β = 10 and the sizes of time averaging intervals are chosen in the range 100−400.
Current usage metrics show cumulative count of Article Views (full-text article views including HTML views, PDF and ePub downloads, according to the available data) and Abstracts Views on Vision4Press platform.
Data correspond to usage on the plateform after 2015. The current usage metrics is available 48-96 hours after online publication and is updated daily on week days.
Initial download of the metrics may take a while.