Free Access
Fig. 11.
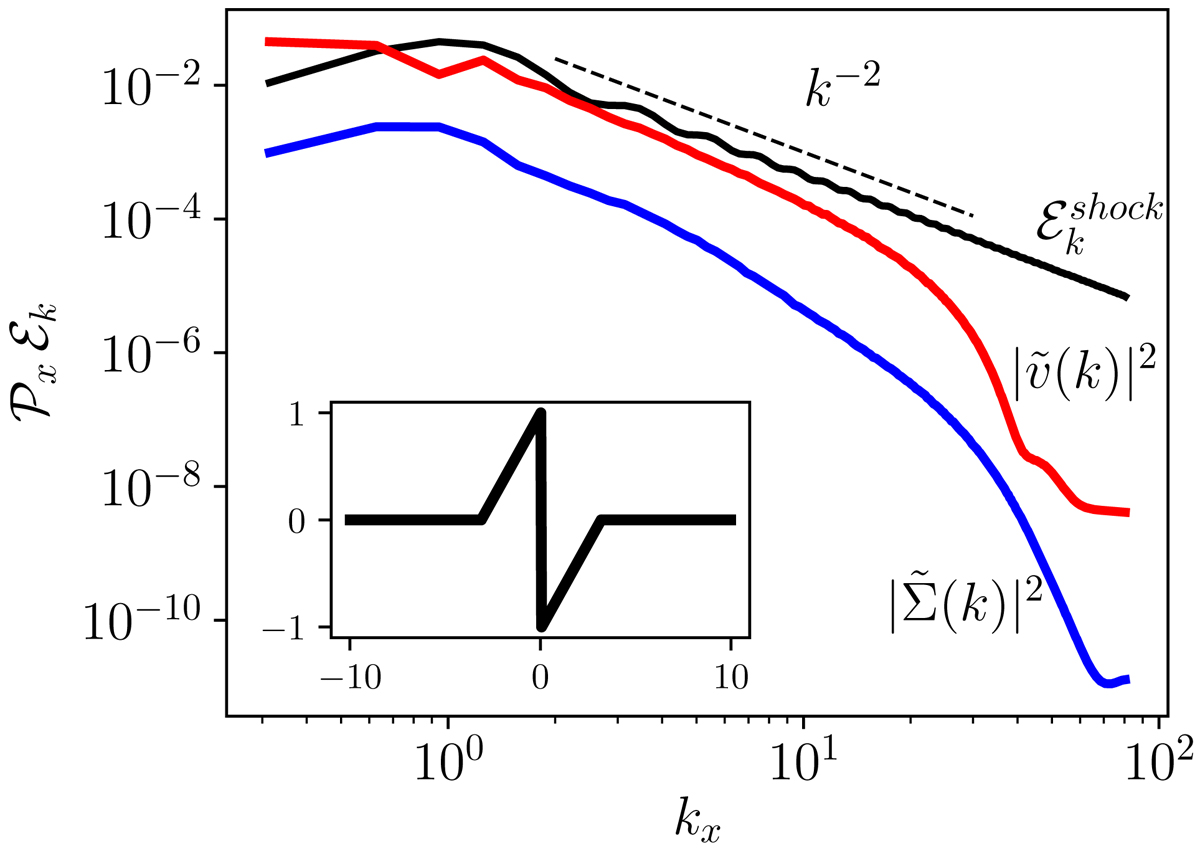
Comparison of the power spectrum for a single shock ![]() with the power spectra for
with the power spectra for ![]() and
and ![]() . The shock width is chosen to be λ = 2π corresponding to k = 1 and is depicted in the small subfigure. The constant c is chosen such that the shock spectrum is more comparable to the simulated spectra.
. The shock width is chosen to be λ = 2π corresponding to k = 1 and is depicted in the small subfigure. The constant c is chosen such that the shock spectrum is more comparable to the simulated spectra.
Current usage metrics show cumulative count of Article Views (full-text article views including HTML views, PDF and ePub downloads, according to the available data) and Abstracts Views on Vision4Press platform.
Data correspond to usage on the plateform after 2015. The current usage metrics is available 48-96 hours after online publication and is updated daily on week days.
Initial download of the metrics may take a while.