Fig. 8.
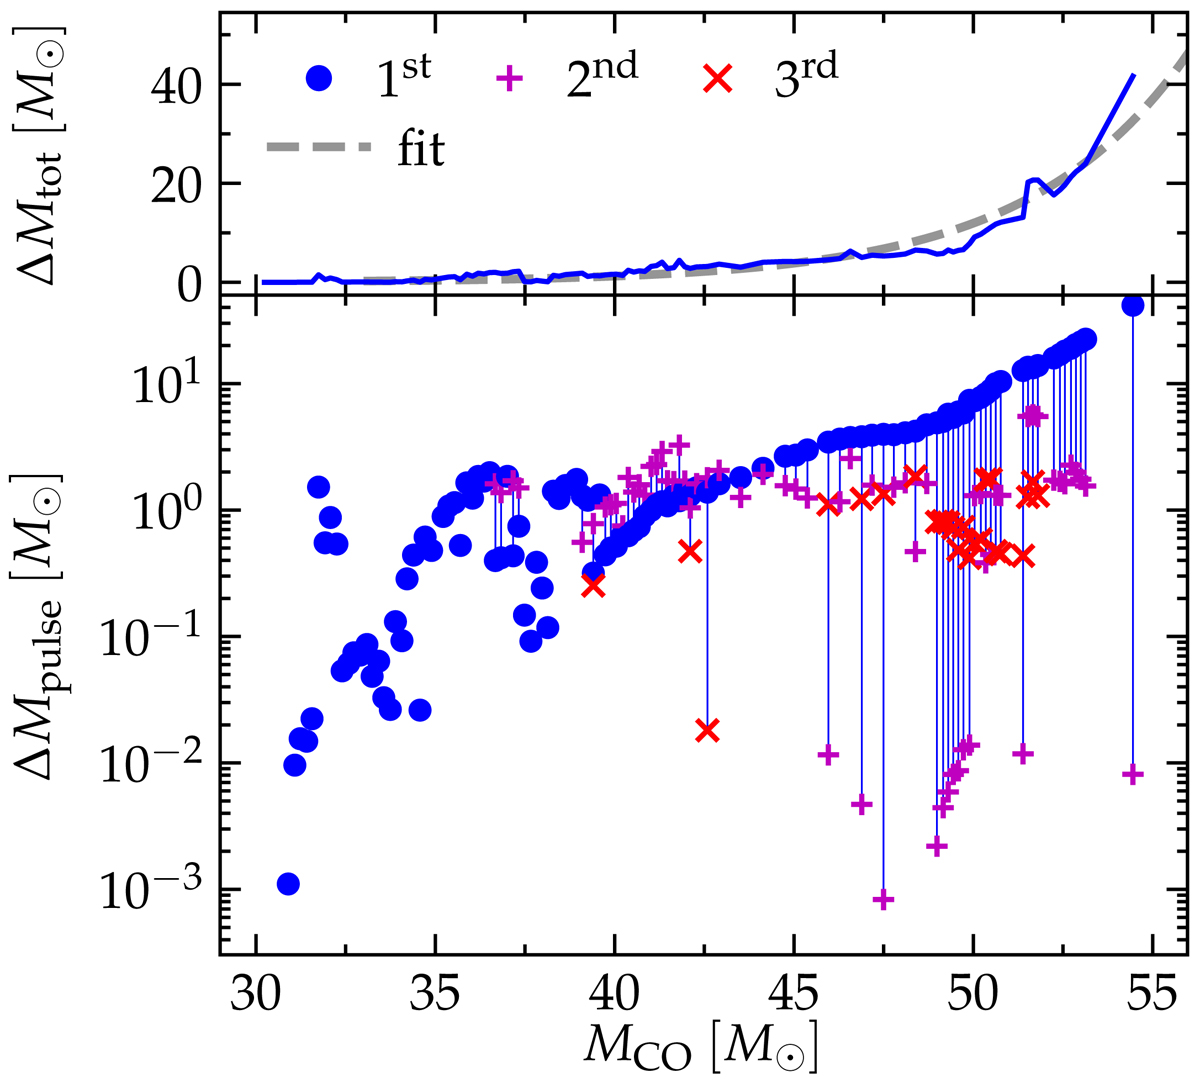
PPI-driven mass loss as a function of the CO core mass. Top panel: total mass ejected in pulses, bottom panel: mass lost in individual pulses. The amount of mass lost does not have a monotonic behavior with pulse number, and spans a wide range of values. The first pulse is shown as a blue dot, and the second and third, if they occur, are shown as a purple plus and red cross, respectively. Thin vertical lines connect multiple pulses for the same MCO.
Current usage metrics show cumulative count of Article Views (full-text article views including HTML views, PDF and ePub downloads, according to the available data) and Abstracts Views on Vision4Press platform.
Data correspond to usage on the plateform after 2015. The current usage metrics is available 48-96 hours after online publication and is updated daily on week days.
Initial download of the metrics may take a while.