Fig. 7.
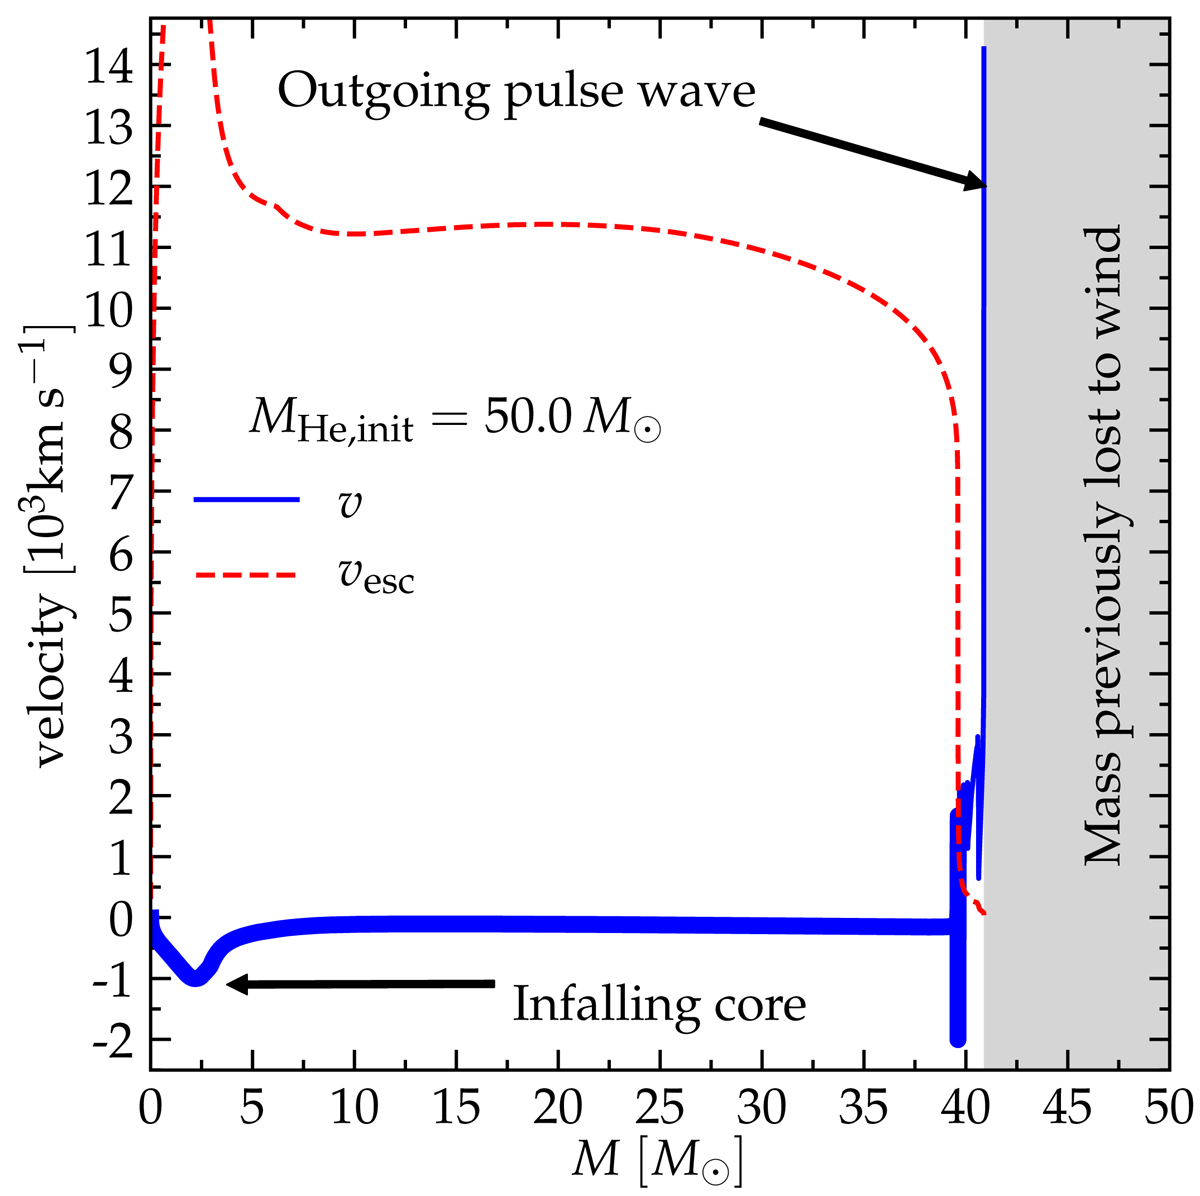
Velocity profile at the onset of core-collapse for a 50 M⊙ He core, which undergoes a PPI mass-loss event while collapsing. The dashed red line shows the escape velocity profile, the thick blue line indicates the profile of the bound material, while the thinner line represents material still on the Lagrangian mass grid, but already beyond the escape velocity. The gray area indicates the model dependent amount of mass lost to stellar winds.
Current usage metrics show cumulative count of Article Views (full-text article views including HTML views, PDF and ePub downloads, according to the available data) and Abstracts Views on Vision4Press platform.
Data correspond to usage on the plateform after 2015. The current usage metrics is available 48-96 hours after online publication and is updated daily on week days.
Initial download of the metrics may take a while.