Fig. 5.
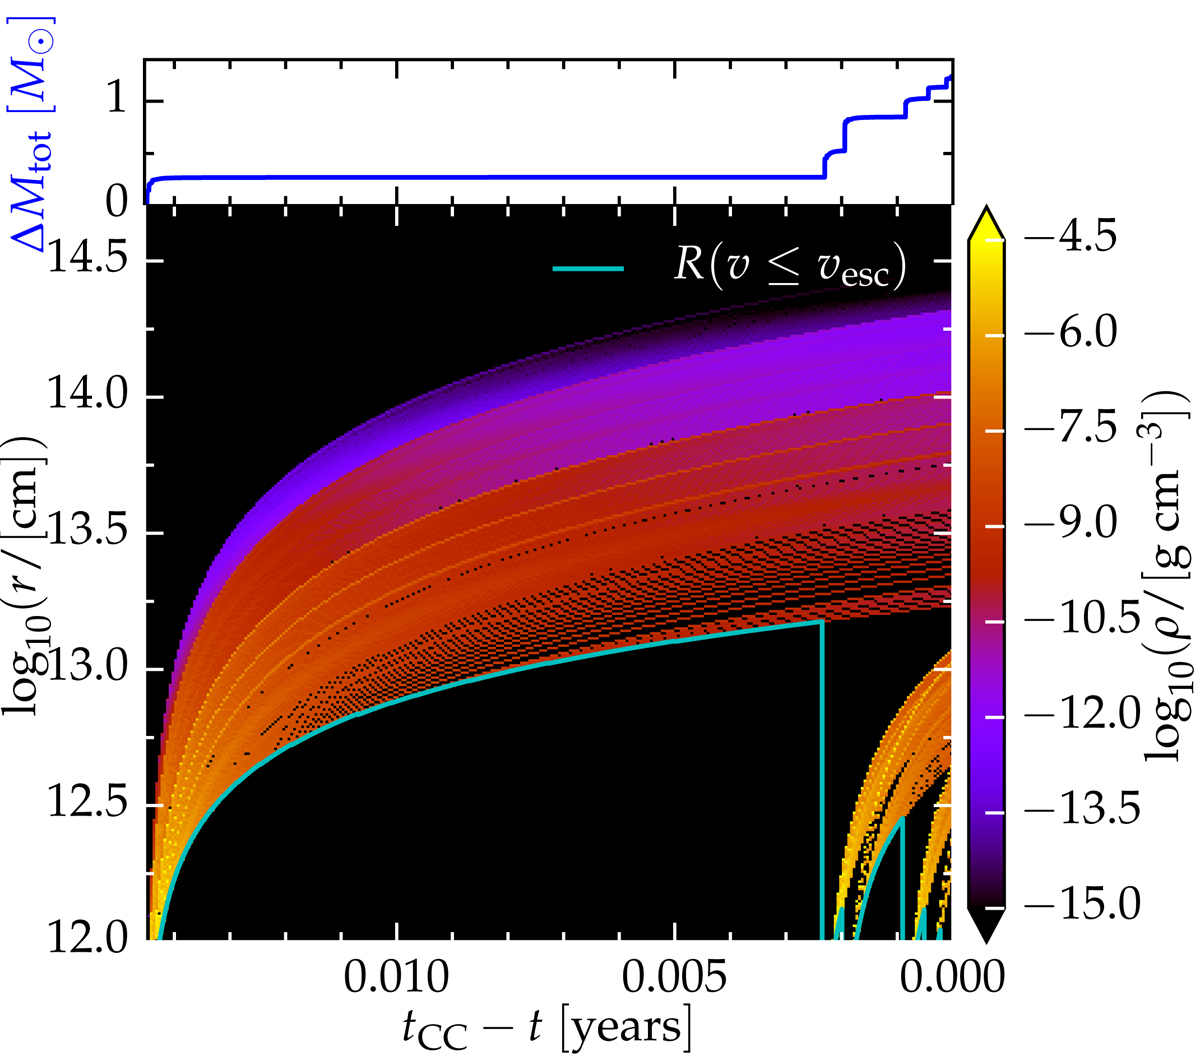
Space-time diagram for propagation of the PPI ejecta of a 50 M⊙ He core. The color indicates the density, assuming radial expansion at constant velocity. The top panel indicates the cumulative amout of ejected at velocities larger than the escape velocity through pulses only (i.e., excluding the wind mass loss). The cyan curve shows the radius of the material instantaneously bound (cf. the red curve in Fig. 4).
Current usage metrics show cumulative count of Article Views (full-text article views including HTML views, PDF and ePub downloads, according to the available data) and Abstracts Views on Vision4Press platform.
Data correspond to usage on the plateform after 2015. The current usage metrics is available 48-96 hours after online publication and is updated daily on week days.
Initial download of the metrics may take a while.