Fig. 14.
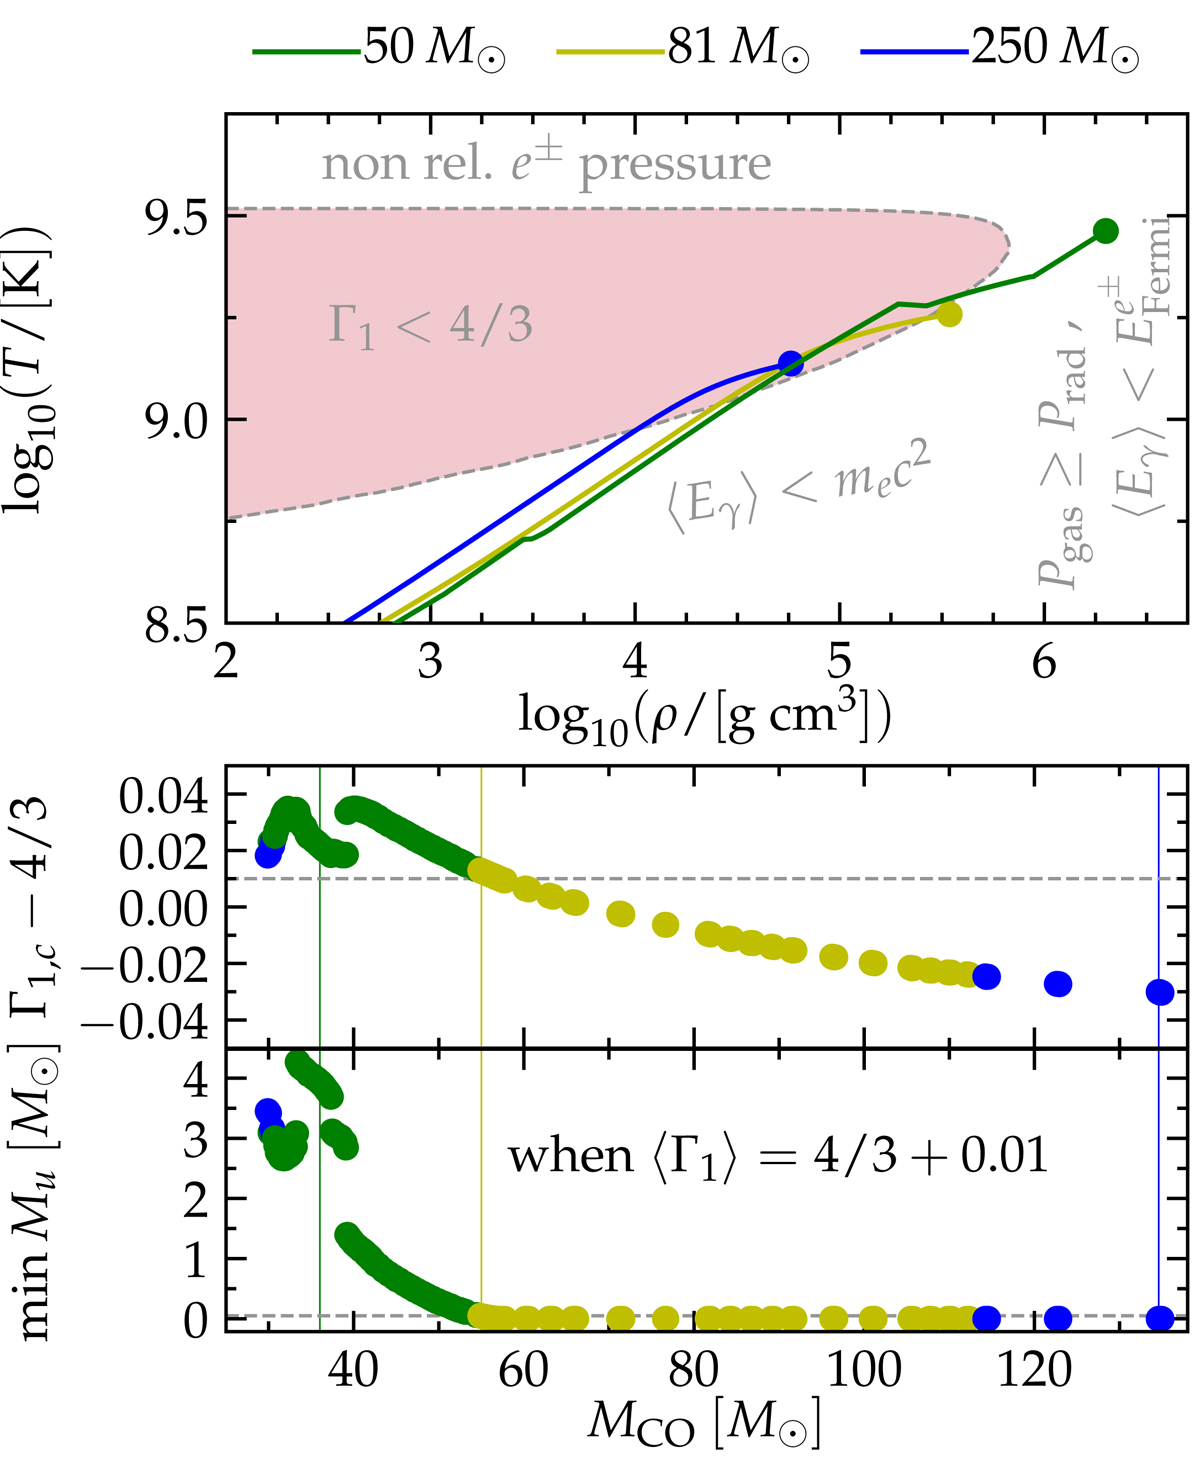
Top panel: temperature and density profiles for example models approaching the instability, i.e., the first time ⟨Γ1⟩−4/3 = 0.01. The filled circles mark the central conditions at this stage. The green, yellow, and blue lines show examples of PPI+CC, PISN, and CC above the mass gap, respectively. All three examples are labeled according to their MHe, init. The red area marks the region of the EOS where pair-production results in an (local) instability. Bottom panel: values of the adiabatic index in the center when approaching the instability for the entire grid. The thin vertical lines mark the MCO of the examples models of the corresponding color in the top panel.
Current usage metrics show cumulative count of Article Views (full-text article views including HTML views, PDF and ePub downloads, according to the available data) and Abstracts Views on Vision4Press platform.
Data correspond to usage on the plateform after 2015. The current usage metrics is available 48-96 hours after online publication and is updated daily on week days.
Initial download of the metrics may take a while.