Fig. 13.
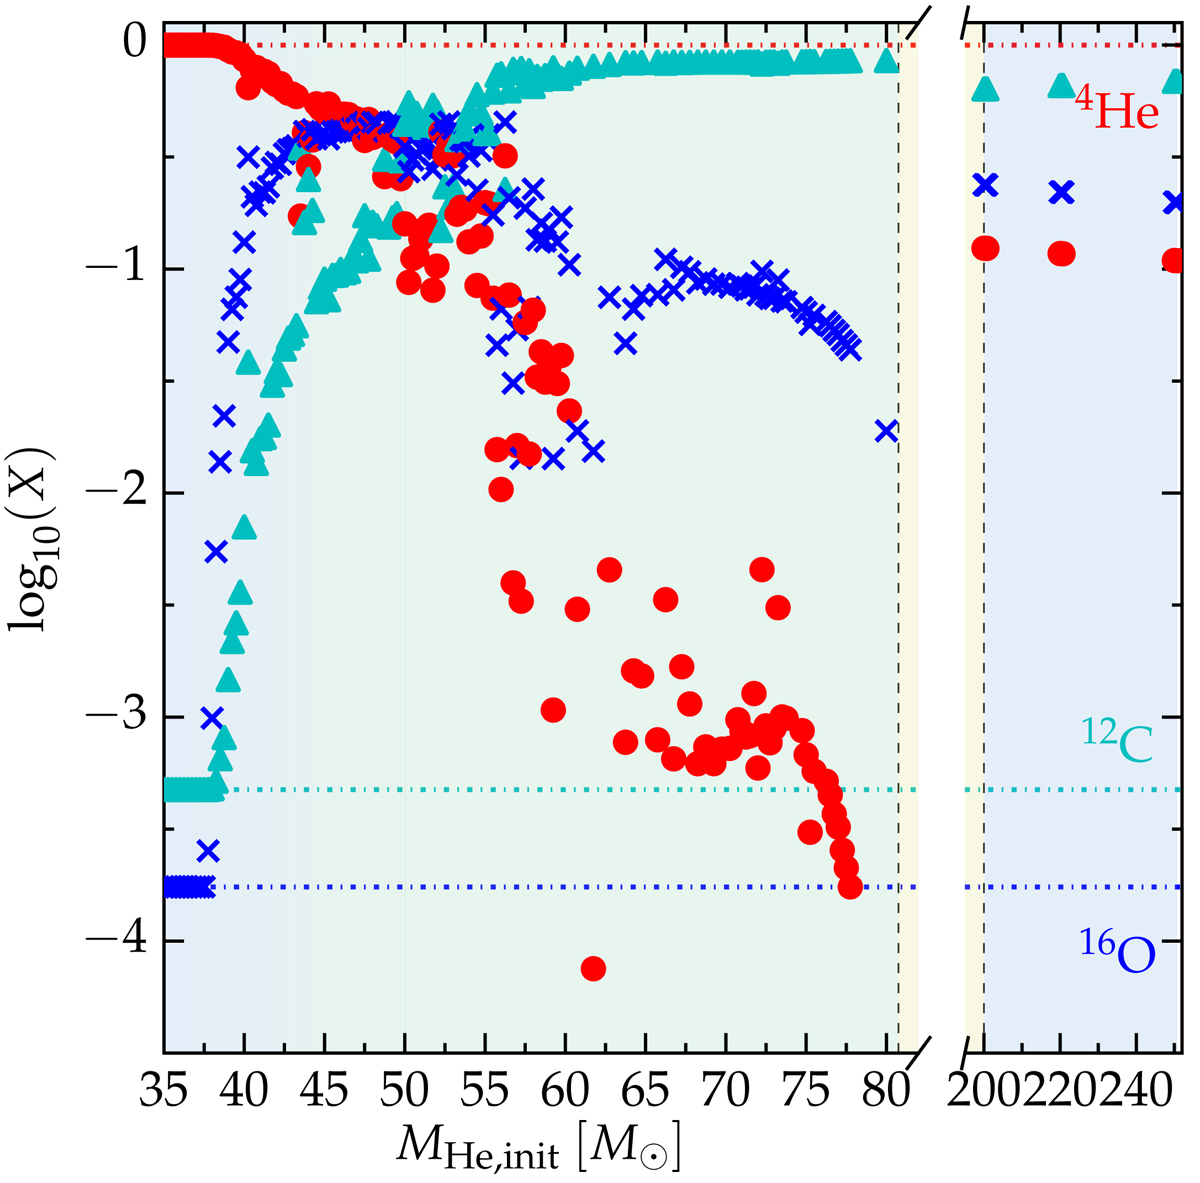
Surface composition at the onset of core-collapse for the PPI+CC and CC models. 4He, 12C, 16O are shown as red filled circles, cyan triangles, and blue crosses, respectively. The dot-dashed horizontal lines of the same color mark the initial mass fraction for these elements for our Z = 0.001 model grid. The colored background indicates the approximate evolution of the star (cf. Fig. 2 and Sect. 3).
Current usage metrics show cumulative count of Article Views (full-text article views including HTML views, PDF and ePub downloads, according to the available data) and Abstracts Views on Vision4Press platform.
Data correspond to usage on the plateform after 2015. The current usage metrics is available 48-96 hours after online publication and is updated daily on week days.
Initial download of the metrics may take a while.