| Issue |
A&A
Volume 639, July 2020
|
|
|---|---|---|
| Article Number | A80 | |
| Number of page(s) | 7 | |
| Section | Interstellar and circumstellar matter | |
| DOI | https://doi.org/10.1051/0004-6361/202037580 | |
| Published online | 13 July 2020 | |
Diffuse γ-ray emission toward the massive star-forming region, W40
1
School of Astronomy and Space Science, Nanjing University,
Nanjing
210093,
PR China
2
Key laboratory of Modern Astronomy and Astrophysics, Nanjing University, Ministry of Education,
Nanjing
210093, PR China
3
Department of Astronomy, School of Physical Sciences, University of Science and Technology of China,
Hefei,
Anhui
230026, PR China
e-mail: This email address is being protected from spambots. You need JavaScript enabled to view it.
4
CAS Key Labrotory for Research in Galaxies and Cosmology, University of Science and Technology of China,
Hefei,
Anhui
230026, PR China
5
School of Astronomy and Space Science, University of Science and Technology of China,
Hefei,
Anhui
230026, PR China
6
Laboratory for Relativistic Astrophysics, Department of Physics, Guangxi University,
Nanning
530004,
PR China
7
Department of Physics, Anhui Normal University,
Wuhu,
Anhui
241000, PR China
8
Dublin Institute for Advanced Studies,
31 Fitzwilliam Place,
Dublin 2, Ireland
9
Max-Planck-Institut für Kernphysik,
Saupfercheckweg 1,
69117
Heidelberg, Germany
Received:
26
January
2020
Accepted:
8
May
2020
Abstract
We report the detection of high-energy γ-ray signal towards the young star-forming region, W40. Using 10-yr Pass 8 data from the Fermi Large Area Telescope (Fermi-LAT), we extracted an extended γ-ray excess region with a significance of ~18σ. The radiation has a spectrum with a photon index of 2.49 ± 0.01. The spatial correlation with the ionized gas content favors the hadronic origin of the γ-ray emission. The total cosmic-ray (CR) proton energy in the γ-ray production region is estimated to be the order of 1047 erg. However, this could be a small fraction of the total energy released in cosmic rays (CRs) by local accelerators, presumably by massive stars, over the lifetime of the system. If so, W40, together with earlier detections of γ-rays from Cygnus cocoon, Westerlund 1, Westerlund 2, NGC 3603, and 30 Dor C, supports the hypothesis that young star clusters are effective CR factories. The unique aspect of this result is that the γ-ray emission is detected, for the first time, from a stellar cluster itself, rather than from the surrounding “cocoons”.
Key words: gamma rays: ISM / cosmic rays
© ESO 2020
1 Introduction
For decades, supernova remnants (SNRs) have been believed to be the main contributors to the Galactic CRs. The detection of γ-rays from a number of SNRs do confirm their ability to accelerate particles to high and very high energies. At the same time, the recent discoveries of γ-ray signals from representatives of other source populations, as well as the impressively precise measurements of primary and secondary CRs, indicate the need for modification of the standard paradigm of Galactic CRs. These data demand the existence of additional contributors to the Galactic CRs. In particular, there is growing evidence that the young star clusters constitute an important class of factories of Galactic CRs (Aharonian et al. 2019). In several such systems, namely the Cygnus cocoon (Ackermann et al. 2011; Aharonian et al. 2019), Westerlund 1 (Abramowski et al. 2012), Westerlund 2 (Yang et al. 2018), NGC 3603 (Yang & Aharonian 2017), and 30 Dor C (H.E.S.S. Collaboration 2015), extended γ-ray (from GeV to TeV) structures with hard energy spectra have been detected.
There are more than a dozen young star clusters that have not been explored so far in the γ-ray band (see, e.g., Portegies Zwart et al. 2010; Davies et al. 2012). One of the reasons is that most of such systems are located inside the Galactic plane, and thus cannot be resolved due to the crowded environments and the limited resolution of γ-ray telescopes. To this regard, the young star-forming region W40, located three degrees above the Galactic plane, is a unique target for γ-ray observations. The W40 complex is one of the nearest sites of massive star formation. The distance to W40 complex is 436.0 ± 9.2 pc derived from a parallax measurement with the VLBA (Ortiz-León et al. 2017). It is composed of a cold molecular cloud (Goss & Shaver 1970) with an area of approximately one square degree. Adjacent to this molecular cloud is a large blister H II region (Westerhout 1958; Vallee 1987) with a diameter of ~6′ and dynamical age of 0.19–0.78 Myr (Mallick et al. 2013). There is a dense stellar cluster within W40 in the IR maps of the Two Micron All Sky Survey (2MASS) and DENIS surveys (Reylé & Robin 2002). This cluster is dominated by four bright OB stars that are believed to be the primary excitation sources for the nearby H II region (Zeilik & Lada 1978; Smith et al. 1985; Shuping et al. 2012). Toward the ~20′ north-west to the W40 region in the Galactic coordinate, there is another star formation region. The young Serpens South cluster was found close to the center of this region (Gutermuth et al. 2008) and is marked in Fig. 1. This cluster consists of a large fraction of protostars, some of which blow out collimated molecular outflows (Nakamura et al. 2011). Nakamura et al. (2014, 2017); Shimoikura et al. (2018) suggested that the two regions might be physically connected based on molecular mapping observations. Initially, the star formation region was found in the W40 region, then the young Serpens South cluster was triggered to form in interaction with the expanding shell of the W40 H II region (Shimoikura et al. 2018). The velocity field around the two regions has a complex composition containing several distinct velocity components; the local standard of the rest velocity VLSR is roughly in the range of 0–15 km s−1 (Shimoikura et al. 2018).
In this paper, we perform a detailed analysis based on the 10-yr Fermi-LAT data toward W40. The paper is organized as follows. In Sect. 2, we present the details of the data analysis. In Sect. 3, we describe the gas distribution in the vicinity of W40. In Sect. 4, we discuss the possible radiation mechanisms of the γ-ray emission. In Sect. 5, the CR content around this region is discussed. In Sect. 6, we present the main implicationsof the obtained results.
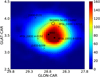 |
Fig. 1 TS residual map above 1 GeV in the 2° × 2° region near W40, with pixel size corresponding to 0.05° × 0.05°, smoothed with a Gaussian filter of 0.45°. The square marks the best-fit central position of the assumed uniform disk used for spatial analysis, and the dashed circle with a radius of 0.46° shows its size. The diamond indicates the radio position of W40, and the small circle with a radius of 0.042° marks the core of the Serpens South Cluster (Gutermuth et al. 2008). The “+” indicate the point sources listed in the 4FGL, and excluded in our background model. The “×” symbol shows pulsars located close to W40 region in projection on the sky. |
2 Fermi-LAT data analysis
We selected the Fermi-LAT Pass 8 database towards the W40 region from August 4, 2008 (MET 239557417) until April 30, 2019 (MET 578338401) for the analysis. We used both the front and back converted photons. A 10° × 10° square region centered at the position of W40 (RA = 277.86°, Dec = −2.07°) is chosen as the region of interest (ROI). We used the “source” event class, recommended for individual source analysis, and the recommended expression (DATA_QUAL > 0) & (LAT_CONFIG = = 1) to exclude time periods when some spacecraft event affected the data quality. To reduce the background contamination from the Earth’s albedo, only the events with zenith angles under 100° were included in the analysis. We processed the data through the current Fermitools from conda distribution1 together with the latest version of the instrument response functions (IRFs) P8R3_SOURCE_V2. We used the python module that implements a maximum likelihood optimization technique for a standard binned analysis2.
In our background model, we included the sources in the Fermi-LAT eight-year catalog (4FGL, Abdollahi et al. 2020) within the region of ROI enlarged by 7°. We left the normalizations and spectral indices free for all sources within 6° distances from W40. For the diffuse background components, we used the latest Galactic diffuse model gll_iem_v07.fits and isotropic emission model iso_P8R3_SOURCE_V2_v1.txt3 keeping their normalization parameters free.
2.1 Spatial analysis
For the study of the spatial distribution of γ-ray emission, we used only the events with energy above 1 GeV. We note there are three 4FGL catalog sources (4FGL J1830.1-0212, 4FGL J1831.6-0223, and 4FGL J1832.4-0152) on top of the W40 complex as marked in Fig. 1. To study the excess γ-ray emission around W40, we excluded these three 4FGL sources from our background model. We used the gttsmap tool to evaluate a 2° × 2° residual TS map by removing the contribution from the all known sources in our background model defined above. The TS value for each pixel is set as TS = − 2(lnL0 −lnL1), where L0 is the maximum-likelihood value for the null hypothesis, and L1 is the maximum likelihood with an additional source located in this pixel. As shown in Fig. 1, a strong γ-ray excess near the W40 position is apparent after the fitting and subtraction of γ-rays from the background sources by performing the likelihood analysis. We added a point-like source model encompassing the W40’s position into our background model, and optimized the localization using the gtfindsrc tool. The derived best-fit position of the excess above 1 GeV is [RA = 277.84°, Dec = −2.24°] (the “square” in Fig. 1), with 2σ error radii of 0.1°, and 0.19° away from the radio position of W40 (Westerhout 1958; Sharpless 1959). Under the assumption of a single point-like source model (Model 1), the significance of the excess γ-ray emission is TS = 214 (~15σ).
We considered several uniform disk templates centered at the above best-fit position with various radii from 0.3° to 0.6° in steps of 0.02° to investigate the spatial extension of the γ-ray emission. We compared the overall maximum likelihood of the uniform disk (L) (alternative hypothesis) with that of the single point-like source model (L0) (null hypothesis), and defined the significance of the disk model − 2(lnL0 −lnL) following the paper by Lande et al. (2012). The alternative hypothesis is significantly preferred to the null hypothesis only if − 2(lnL0 −lnL) > 16. The spectral types of all the added sources for the likelihood ratio test are assumed to be a simple power law. We found that the uniform disk template with a radius of Rdisk ~ 0.46° ± 0.02° (Model 2) can best fit the γ-ray excess, and the improved significance is ΔTS = 103 (~10.2σ) with one additional degree of freedom (dof) relative to the single point-like source model. The photon index is 2.49 ± 0.01, and the total γ-ray flux is estimated as(4.43 ± 0.27) × 10−9 ph cm−2 s−1 above 1 GeV. The associated uncertainties correspond to the 68% statistical errors. Considering the distance of about 430 pc, the total γ-ray luminosity is estimated to be (6.4 ± 0.4) × 1032erg s−1.
To study whether the extended nature of the GeV emission is caused by a superposition of several separate point-like sources, we removed the uniform disk model and recovered the three deleted 4FGL point-like sources (Model 3). The maximum-likelihood value listed in Table 1 appeared to be smaller than the uniform disk case, even with more free parameters. Thus, the three point source scenario is disfavored compared to the uniform disk model. Both the star formation regions of W40 and Serpens South Cluster lie within the ~ 0.46° uniform disk template of the best-fit position, and we cannot yet rule out the possibility that the GeV γ-ray emissions, at least in part, originate from the Serpens South Cluster. Thus, we put a single point-like source at the position of the Serpens South Cluster instead of W40 (Model 4), and the most possible combination of two point-like sources (Model 5), namely, one point-like source at the best fit location, and another one at the position of the Serpens South Cluster. The fit maximum-likelihood values are smaller than those of Model 2. Thus, the GeV emission originating from the Serpens South Cluster is disfavored compared to the W40 region. Table 1 lists the models and the log (likelihood) values.
2.2 Spectral and variability analyses
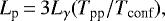
To study thespectral properties of γ-ray emission towards W40 and the energy distribution of the parent particles, we fixed the 0.46° uniform circle disk as the spatial model of the extended emission, and assumed a power-law spectral shape.
We divided the energy range 200 MeV–60 GeV into nine logarithmically spaced energy bins and derived the spectral energy distribution (SED) via the maximum-likelihood method. The results are shown in Fig. 2. The significance of the signal detection for each energy bin exceeds 2σ. We calculated 68% statistical errors for the energy flux densities. We also estimated the uncertainties caused by the imperfection of the Galactic diffuse background model by changing the normalization artificially by ±6% from the best-fit value for each energy bin, and we considered the maximum flux deviation of the source as the systematic error (Abdo et al. 2009).
We tested the possible variability of this source by producing the light curve. This was done by binning the whole data set used into ten equidistant time bins and deriving the γ-ray spectrum above 1 GeV in each of these bins. The results are shown in Fig. 3. We find statistically significant signals in all time bins, without any indication of flux variability. By fitting the light curve with a horizontal line, the derived reduced chi-squared χ2 ∕dof = 0.88, which is consistent with a constant flux.
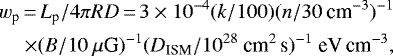
3 Gas content around W40
We investigated three different gas phases within the 0.46° uniform disk shown in Fig. 1 (hereafter called γ-ray emission region): theneutral atomic hydrogen (H I), the molecular hydrogen (H2), and the ionized hydrogen (H II). We calculated the H I column densities NH I from the data-cube of the H I 4π survey (HI4PI), which is a 21-cm all-sky database of Galactic H I (HI4PI Collaboration 2016). We used the equation
 (1)
(1)
where Tbg ≈ 2.66 K was the brightness temperature of the cosmic microwave background (CMB) radiation at 21-cm, and TB is the measured brightness temperature in 21-cm surveys. In the case of TB > Ts − 5 K, we truncated TB to Ts − 5 K. A uniform spin temperature Ts = 150 K was adopted.
We used the carbon monoxide (CO) composite survey (Dame et al. 2001) to trace the H2. The standard assumption of a linear relationship between the velocity-integrated brightness temperature of CO 2.6-mm line, WCO, and the column density of molecular hydrogen, N(H2), meaning N(H2) = XCO × WCO (Lebrun et al. 1983) were used. The conversion factor XCO was chosen to be 2.0 × 1020 cm−2 K−1 km−1 s (Bolatto et al. 2013; Dame et al. 2001). We integrated the velocity interval from 0–15 km s−1 based on the results of Fig. 2 of Shimoikura et al. (2018) for the column density calculations of both H I and H2.
The W40 complex also harbors a bright ionized hydrogen region. We adopted the free–free emission map derived from the joint analysis of Planck, WMAP, and 408 MHz observations (Planck Collaboration X 2016) to obtain the map of H II column density. We first converted the emission measure (EM) into free-free intensity (Iν) by using the conversion factor at 353-GHz in Table 1 of Finkbeiner (2003). Then we used Eq. (5) in Sodroski et al. (1997),
 (2)
(2)
to convert the free-free intensity into column density in each pixel, at the frequency ν = 353 GHz, and the electron temperatureof Te = 8000 K. This equation shows that the H II column density is inverse proportional to the effective density of electrons ne, thus we chose 2 cm−3 and 10 cm−3 (Sodroski et al. 1997) to calculate the upper and lower limits of the H II column density.
The derived maps of gas column densities in three phases are shown in Fig. 4. We note that, similar to the case of the young massive cluster NGC 3603 (Yang & Aharonian 2017), the γ-ray emission region shows good spatial consistency with the H II column densities, which supports the hypothesis that the γ-ray emission comes from the interactions of the accelerated particles in the superbubble.
The total mass of the cloud in each pixel can be obtained from the expression
 (3)
(3)
where mH is the mass of the hydrogen atom, and  is the total column density of the hydrogen atom in each pixel. Aang is the angular area, and d is the distance of the W40 complex. We calculated the total mass and number of hydrogen atoms in each pixel. The total mass in the γ-ray emission region is estimated inthe range of 1.47 × 10² M⊙ < M < 5.49 × 10³ M⊙ as listed in Table 2. We note that the uncertainty of the gas mass is significant, this is because we cannot exclude the possibility that the γ-ray emissions are associated only with the H II gas due to the compact nature of the γ-ray emission region (pc scale), and the mass of the H II gas is an order of magnitude lower than the total gas mass. Assuming spherical geometry of the γ-ray emission region, its radius is estimated as r = d × θ ~ 436 pc × (0.46° × π∕180°) rad ~ 3.5 pc. Thus, the average gas number density over the volume should be within 30 cm−3 < ngas < 1200 cm−3. Because of the good correlation of γ-ray emission with the H II gas, below we used ngas ~ 30 cm−3 as a fiducial value, but kept in mind that strictly speaking it should be regarded as a lower limit.
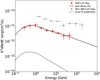 |
Fig. 2 SED of the γ-ray emission toward W40 for a spatially uniform disk model with a radius of 0.46°. Both the statistical and systematic errors for the six low-energy bins are considered. The solid curve represents the spectrum of γ-rays from interactions of relativistic protons with the ambient gas, assuming a power-law distribution of protons (see Sect. 4). The dashed curve represents the predicted fluxes of γ-ray emission derived from the H II column density map, the CRs are assumed to have the same spectra as measured in the solar neighborhood (Aguilar et al. 2015). (For details, see the context in Sect. 3.) The gray data points are the fluxes ofNGC 3603 taken from Yang & Aharonian (2017). |
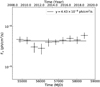 |
Fig. 3 Light curve of γ-ray emission towards W40 from August 4, 2008 (MJD 54 683) until April 30, 2019 (MJD 58 604). |
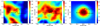 |
Fig. 4 Maps of gas column densities in three phases, smoothed with a Gaussian kernel of 0.6°. The marks are the same as in Fig. 1. Left: H I column density derived from 21-cm all-sky survey. Middle: H2 column density derived from the CO data. Right: H II column density derived from the Planck free–free map. For details, see the context in Sect. 3. |
Total mass of the hydrogen atom derived from different tracers within the γ-ray emission region.
4 The origin of γ-ray emission
In principle, it is possible that some γ-ray residuals arise because of the imperfect modeling of the Galactic diffuse γ-ray background. In particular, we note that the H II component of gas is not taken into account in the Fermi diffuse background models (Acero et al. 2016). However, as is shown in Fig. 2, the predicted γ-ray flux for the H II gas (assuming that the CR spectra therein are the same as the local measurement Aguilar et al. 2015) is significantly lower than the observed γ-ray flux. Thus, the derived γ-ray flux from this region cannot be caused by uncertainties in the modeling of the diffuse background. Two pulsars are located about 0.5° away from the center of the γ-ray emission region (as shown in Fig. 1), PSR J1830-0131 and PSR J1833-0209 (Manchester et al. 2005). The region PSR J1830-0131 has a distance of 3.5 kpc and a spin-down luminosity of 2.3 × 1034 erg s−1, while for J1833-0209, the values are 13.3 kpc and 4.4 × 1033 erg s−1, respectively. If we assume that the γ-ray emission comes from the pulsar wind nebulae associated with these two pulsars, the derived γ-ray luminosities would be about 5 × 1034 erg s−1 and 6 × 1035 erg s−1, respectively. They significantly exceed the spin-down luminosities of the pulsars. This makes the association of the γ-ray emission to these pulsars rather unlikely. On the other hand, there are no known SNRs inside this region (Green 2014). Thus the γ-ray emission most likely originates from W40 itself.
We used Naima4 (Zabalza 2015) to fit the SEDs. Naima is a numerical package that allows us to implement different functions and includes tools to perform Markov chain Monte Carlo (MCMC) fitting of nonthermal radiative processes to the data. In the hadronic scenario, we attribute the observed γ-rays to the decay ofneutral pions produced by the interactions of protons with the ambient gas, using the parameterization of the cross-section of Kafexhiu et al. (2014). Since the low-energy data points are not very constrained, we assume a power-law distribution in the momentum of the protons. The average number density of the target protons is assumed to be 30 cm−3, which is the lower limit derived from the gas distributions above. As shown in Fig. 2, the derived index is α = 2.55 ± 0.14, and the total energy is Wp = (2.1 ± 0.5) × 1046 erg for the protons above 10 GeV. It should be noted that, due to the good spatial correlation of γ-ray emission and H II maps, it is very probable that the γ-rays are only related to H II gas. In this case, as is shown in Fig. 2, the derived CR density is about 10–50 times that of the local CRs.
We also tested the leptonic scenario assuming the γ-rays are generated via the relativistic electrons inverse Compton (IC) scattering of low-energy seed photons, or through the nonthermal bremsstrahlung of the relativistic electrons or matter around the W40 region. For the interstellar radiation field of the IC, we considered the CMB, infrared, and optical emissions calculated by Popescu et al. (2017). The target particle density is assumed to be 30 cm−3 for the relativistic bremsstrahlung. We adopted the formalism described in Khangulyan et al. (2014) to calculate the IC spectrum, and for the relativistic bremsstrahlung spectrum we used the parameterization in Baring et al. (1999). To fit the lower energy break in the γ-ray spectrum, we should require a relevant break in the spectrum of parent electrons. Thus, we assumed a broken power law distribution of the relativistic electrons. As shown in Fig. 5, both the IC and bremsstrahlung model can fit the observable data well, and the corresponding maximum-likelihood values are −4.3 and −1.7. For IC, the derived parameters for the electrons are 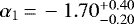 ,
,  , Ebreak = 7.30 ± 0.90 GeV, and total energy We = (1.8 ± 0.2) × 1048 erg. For bremsstrahlung, α1 = − 0.20 ± 0.50, α2 = 2.65 ± 0.10, Ebreak = 1.01 ± 0.14 GeV, and We = (2.1 ± 0.2) × 1046 erg. In the regime of bremsstrahlung, the high-energy index of parent electrons α2 is similar to the γ-ray spectral index γ, while in the IC regime the relation is different,
  .
.
We cannot formally rule out the leptonic origin of this source. In such a dense region, the bremsstrahlung dominates the radiation mechanism. The good spatial coincidence of the γ-ray emission with the H II region favors a hadronic or bremsstrahlung origin. However, in the bremsstrahlung scenario, the derived parent proton index changed from −0.2 to 2.65 below and above about 1 GeV. Such a sharp break is quite unusual and not compatible with any known mechanisms.
If the γ-ray emission is dominated by the pion decay process, we can use the γ-ray emissions to study the CR proton content in this region. To do this, we calculated the γ-ray emission under the assumption that the CR density around the W40 region coincides with the density in the Solar System measured by AMS-02 (Aguilar et al. 2015), with an nuclear enhancement factor of 1.8. We compared the predictions with the SED derived from the Fermi-LAT observations shown in Fig. 2, and the local CR fluxes are lower and the energy spectra are softer than the observed Fermi-LAT data. Thus, the CR proton spectrum in this region is significantly harder than the local observations, whilst the CR energy density above 10 GeV is an order of magnitude higher than that of the local CRs when we attribute the γ-ray emission to the H II region.
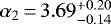
5 CR content in the vicinity of W40
If the massive star clusters are indeed CR accelerators, the CRs will inevitably escape and distribute in the vicinity of the massive star clusters. The distribution of CRs can be derived from the γ-ray emission and gas distributions. In Westerlund 1, the Cygnus Cocoon (Aharonian et al. 2019), and Westerlund 2 (Yang et al. 2018), the 1∕r CR profiles are derived, which implies the continuous injection and diffusion dominated propagation of CRs from these massive star clusters.
For W40, the size of the detected γ-ray emission region is only of several parsecs, thus probably dominated by the emission from the cluster itself, rather than the cocoons illuminated by the propagating CRs. To study the propagated CR contents in the vicinity, we divided the inner five-degree region from W40 into four rings, with radii of [0.5:2], [2:3], [3:4], and [4:5] degrees. The TS maps in these regions are shown in Fig. 6. Due to the lack of the γ-ray emission, we derived the 99% γ-ray upper limits in each ring. We also derived the corresponding gas mass as in Sect. 3. Using the γ-ray production cross-section (Kafexhiu et al. 2014), we derived the CR density upper limits profile from the γ-ray upper limits and gas distributions, the results are shown in Fig. 7. It seems that the second bin gives stringent constrain on the CR density. It can hardly be compatible with the γ-ray emission detected in W40 itself if we assumea 1∕r profile. However, it is also possiblethat the γ-ray emission in W40 itself can not be regarded as the beginning of the CR profile. Indeed, the CRs produced in W40 may be confined inside the source due to the much slower diffusion in the source region, which forms the γ-ray emission region. The CR luminosity Lp can be estimated from γ-ray luminosity Lγ as
 (4)
(4)
where 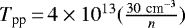 s is the CR cooling time through pp collision and Tconf = R∕2D is the confinement time in the γ-ray emission region. Here, n is the ambient gas density, R is the size of the γ-ray emission region, and D is the diffusion coefficient. Formally, D can be expressed as
  , where rg is the gyro radius, DB is Bohm diffusion coefficient, and k labels the deviation from Bohm diffusion. Thus, the CR luminosity can be expressed as
 (5)
(5)
If Tpp is much larger than Tconf, most of the accelerated CRs will gradually diffuse out the source region. Assuming a continuous injection and the CR density scale as 1∕r, the energy density at the second bin in Fig. 7 can be estimated as (Aharonian & Atoyan 1996)
 (6)
(6)
where wp is the CR energy density, DISM is the diffusion coefficient in the interstellar medium, and R is 15 pc, which is the distance from the second bin to W40. Compared with the derived CR energy density of 5 × 10⁻³ erg cm−3 for the second bin in Fig. 7, the derived k should be smaller than about 1000, which can be regarded as a hint that the diffusion in the vicinity of W40 is much smaller than the average value in the interstellar medium (in which k can be as large as 106).
The γ-ray upper limits reveal a slow diffusion region in the vicinity of W40. This is not surprising, considering the possible strong turbulence and effective CR confinement surrounding the CR accelerators (see, e.g., Malkov et al. 2013). This is also in consistency with our assumption that the detected γ-ray emissions are from the star cluster itself.
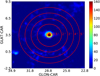 |
Fig. 6 TS residual map above 1 GeV overlaid with the rings used to derived upper limits of cosmic ray energy density in Sect. 5. |
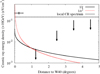 |
Fig. 7 Derived CR density profile near W40. The data points are the γ-ray emission above 1 GeVof W40. The upper limits are derived for the rings defined in Fig. 6. The balck and red curves are the projected 1∕r and 1∕r2 profiles, respectively. |
6 Discussion and conclusion
Recently, Aharonian et al. (2019) proposed that young star clusters can be an alternative source population of Galactic CRs, and the γ-ray emissions around such objects can be powerful tools to diagnose the acceleration of CRs and propagation of CRs in the vicinity of sources. For now, there are already several such systems that have been detected in γ-ray band, such as the Cygnus cocoon (Ackermann et al. 2011; Aharonian et al. 2019), Westerlund 1 (Abramowski et al. 2012), Westerlund 2 (Yang et al. 2018), NGC 3603 (Yang & Aharonian 2017), and 30 Dor C (H.E.S.S. Collaboration 2015). Here, we report a statistically significant detection of an extended γ-ray signal from the direction of another young star-forming region, W40. Like the other systems, the spectrum of this source is harder than the local CRs. We argue that the most likely origin of the detected emission is the interactions of CRs accelerated in the young star cluster with the surrounding ionized gas.
Compared with other systems, W40 is unique considering that it is located only 400 pc away from the Solar System and is extremely young at less than 1 Myr. Within such a young star forming system, no stars can have enough time to evolve into a supernova. Thus, if the γ-rays are illuminated by CRs accelerated in W40, the only feasible acceleration sites for CRs are the stellar winds of young massive stars. Furthermore, it is the first time the γ-ray emission has been detected in pc scale, rather than the 100 pc cocoons observed in other systems. Additionally, the size of the detected γ-ray emissions is not far from the stellar cluster itself. Thus, it is likely that the observed γ-rays are directly from the stellar cluster.
The total CR energy in W40 is only to the order of 1047 erg, which is much lower than that derived from the similar systems such as NGC 3603 (Yang & Aharonian 2017), Westerlund 2 (Yang et al. 2018), and the Cygnus cocoon (Ackermann et al. 2011; Aharonian et al. 2019). However, the determination of the total CR energy from γ-ray emissions is not decisive. It is possible that CRs are distributed in a much larger area with a much lower gas density. In this case, if the CRs are distributed as 1∕r as derived from other stellar clusters (Aharonian et al. 2019), the total CR energy scales as R2, where R is the maximum distance penetrated by a particle accelerated by W40. Thus, the total CR energy can be orders of magnitude larger if R is dozens of parsecs, as in other systems. Also, W40 is much less powerful than the other detected systems. There are only four identified OB stars, compared with more than a dozen in other systems. Therefore, it is reasonable to assume the wind power in W40 can be orders of magnitude lower. In this case, it is not surprising that W40 reveals a much lower CR luminosity. Meanwhile, the derived index of CR proton spectrum (~ 2.5) is also slightly softer than that in other observed massive star clusters (~ 2.2−2.3). This may be also due to the younger age of this star cluster, as well as a lower wind power compared with other systems that were observed at greater distances. Another possibility is that the difference reflects the different CR spectra in the star cluster and in the surrounding cocoon, which can be induced by the propagation effects. A dedicated study of the mechanisms of acceleration and propagation, as well as a careful multiwavelength observationsto estimate the total wind power in such systems are required to explain such differences. Also, if there are other objects like W40 but located at greater distances, they may be difficult to be resolved by current γ-ray observations. In this case, however, such objects may contribute significantly to the diffuse γ-ray emission. Thus, further caution is required to extract the CR information from diffuse γ-ray emissions (e.g., Acero et al. 2016; Yang et al. 2016).
Acknowledgements
This work is supported by the NSFC under grants 11421303, 11625312 and 11851304 and the National Key R & D program of China under the grant 2018YFA0404203. Ruizhi Yang is supported by the national youth thousand talents program in China.
References
- Abdo, A. A., Ackermann, M., Ajello, M., et al. 2009, ApJ, 706, L1 [NASA ADS] [CrossRef] [Google Scholar]
- Abdollahi, S., Acero, F., Ackermann, M., et al. 2020, ApJS, 247, 33 [NASA ADS] [CrossRef] [Google Scholar]
- Abramowski, A., Acero, F., Aharonian, F., et al. 2012, A&A, 537, A114 [NASA ADS] [CrossRef] [EDP Sciences] [Google Scholar]
- Acero, F., Ackermann, M., Ajello, M., et al. 2016, ApJS, 223, 26 [NASA ADS] [CrossRef] [EDP Sciences] [Google Scholar]
- Ackermann, M., Ajello, M., Allafort, A., et al. 2011, Science, 334, 1103 [NASA ADS] [CrossRef] [PubMed] [Google Scholar]
- Aguilar, M., Aisa, D., Alpat, B., et al. 2015, Phys. Rev. Lett., 114, 171103 [CrossRef] [PubMed] [Google Scholar]
- Aharonian, F. A., & Atoyan, A. M. 1996, A&A, 309, 917 [Google Scholar]
- Aharonian, F., Yang, R., & de Oña Wilhelmi, E. 2019, Nat. Astron., 3, 561 [NASA ADS] [CrossRef] [Google Scholar]
- Baring, M. G., Ellison, D. C., Reynolds, S. P., Grenier, I. A., & Goret, P. 1999, ApJ, 513, 311 [NASA ADS] [CrossRef] [Google Scholar]
- Bolatto, A. D., Wolfire, M., & Leroy, A. K. 2013, ARA&A, 51, 207 [Google Scholar]
- Dame, T. M., Hartmann, D., & Thaddeus, P. 2001, ApJ, 547, 792 [NASA ADS] [CrossRef] [Google Scholar]
- Davies, B., de La Fuente, D., Najarro, F., et al. 2012, MNRAS, 419, 1860 [NASA ADS] [CrossRef] [Google Scholar]
- Finkbeiner, D. P. 2003, ApJS, 146, 407 [NASA ADS] [CrossRef] [Google Scholar]
- Goss, W. M., & Shaver, P. A. 1970, Aust. J. Phys. Astrophys. Suppl., 14, 1 [Google Scholar]
- Green, D. A. 2014, Bull. Astron. Soc. India, 42, 47 [NASA ADS] [Google Scholar]
- Gutermuth, R. A., Bourke, T. L., Allen, L. E., et al. 2008, ApJ, 673, L151 [NASA ADS] [CrossRef] [Google Scholar]
- H.E.S.S. Collaboration (Abramowski, A., et al.) 2015, Science, 347, 406 [NASA ADS] [CrossRef] [Google Scholar]
- HI4PI Collaboration (Ben Bekhti, N., et al.) 2016, A&A, 594, A116 [NASA ADS] [CrossRef] [EDP Sciences] [Google Scholar]
- Kafexhiu, E., Aharonian, F., Taylor, A. M., & Vila, G. S. 2014, Phys. Rev. D, 90, 123014 [NASA ADS] [CrossRef] [Google Scholar]
- Khangulyan, D., Aharonian, F. A., & Kelner, S. R. 2014, ApJ, 783, 100 [NASA ADS] [CrossRef] [Google Scholar]
- Lande, J., Ackermann, M., Allafort, A., et al. 2012, ApJ, 756, 5 [NASA ADS] [CrossRef] [Google Scholar]
- Lebrun, F., Bennett, K., Bignami, G. F., et al. 1983, ApJ, 274, 231 [NASA ADS] [CrossRef] [Google Scholar]
- Malkov, M. A., Diamond, P. H., Sagdeev, R. Z., Aharonian, F. A., & Moskalenko, I. V. 2013, ApJ, 768, 73 [NASA ADS] [CrossRef] [Google Scholar]
- Mallick, K. K., Kumar, M. S. N., Ojha, D. K., et al. 2013, ApJ, 779, 113 [NASA ADS] [CrossRef] [Google Scholar]
- Manchester, R. N., Hobbs, G. B., Teoh, A., & Hobbs, M. 2005, AJ, 129, 1993 [NASA ADS] [CrossRef] [Google Scholar]
- Nakamura, F., Sugitani, K., Shimajiri, Y., et al. 2011, ApJ, 737, 56 [NASA ADS] [CrossRef] [Google Scholar]
- Nakamura, F., Sugitani, K., Tanaka, T., et al. 2014, ApJ, 791, L23 [NASA ADS] [CrossRef] [Google Scholar]
- Nakamura, F., Dobashi, K., Shimoikura, T., Tanaka, T., & Onishi, T. 2017, ApJ, 837, 154 [NASA ADS] [CrossRef] [Google Scholar]
- Ortiz-León, G. N., Dzib, S. A., Kounkel, M. A., et al. 2017, ApJ, 834, 143 [NASA ADS] [CrossRef] [Google Scholar]
- Planck Collaboration X. 2016, A&A, 594, A10 [NASA ADS] [CrossRef] [EDP Sciences] [Google Scholar]
- Popescu, C. C., Yang, R., Tuffs, R. J., et al. 2017, MNRAS, 470, 2539 [NASA ADS] [CrossRef] [Google Scholar]
- Portegies Zwart, S. F., McMillan, S. L. W., & Gieles, M. 2010, ARA&A, 48, 431 [NASA ADS] [CrossRef] [Google Scholar]
- Reylé, C., & Robin, A. C. 2002, A&A, 384, 403 [NASA ADS] [CrossRef] [EDP Sciences] [Google Scholar]
- Sharpless, S. 1959, ApJS, 4, 257 [Google Scholar]
- Shimoikura, T., Dobashi, K., Nakamura, F., Shimajiri, Y., & Sugitani, K. 2018, PASJ, 131 [Google Scholar]
- Shuping, R. Y., Vacca, W. D., Kassis, M., & Yu, K. C. 2012, AJ, 144, 116 [NASA ADS] [CrossRef] [Google Scholar]
- Smith, J., Bentley, A., Castelaz, M., et al. 1985, ApJ, 291, 571 [NASA ADS] [CrossRef] [Google Scholar]
- Sodroski, T. J., Odegard, N., Arendt, R. G., et al. 1997, ApJ, 480, 173 [NASA ADS] [CrossRef] [Google Scholar]
- Vallee, J. P. 1987, A&A, 178, 237 [NASA ADS] [Google Scholar]
- Westerhout, G. 1958, Bull. Astron. Inst. Netherlands, 14, 215 [NASA ADS] [Google Scholar]
- Yang, R.-z., & Aharonian, F. 2017, A&A, 600, A107 [NASA ADS] [CrossRef] [EDP Sciences] [Google Scholar]
- Yang, R., Aharonian, F., & Evoli, C. 2016, Phys. Rev. D, 93, 123007 [Google Scholar]
- Yang, R.-z., de Oña Wilhelmi, E., & Aharonian, F. 2018, A&A, 611, A77 [NASA ADS] [CrossRef] [EDP Sciences] [Google Scholar]
- Zabalza, V. 2015, International Cosmic Ray Conference, 34, 922 [Google Scholar]
- Zeilik, II, M., & Lada, C. J. 1978, ApJ, 222, 896 [NASA ADS] [CrossRef] [Google Scholar]
All Tables
Total mass of the hydrogen atom derived from different tracers within the γ-ray emission region.
All Figures
|
Fig. 1 TS residual map above 1 GeV in the 2° × 2° region near W40, with pixel size corresponding to 0.05° × 0.05°, smoothed with a Gaussian filter of 0.45°. The square marks the best-fit central position of the assumed uniform disk used for spatial analysis, and the dashed circle with a radius of 0.46° shows its size. The diamond indicates the radio position of W40, and the small circle with a radius of 0.042° marks the core of the Serpens South Cluster (Gutermuth et al. 2008). The “+” indicate the point sources listed in the 4FGL, and excluded in our background model. The “×” symbol shows pulsars located close to W40 region in projection on the sky. |
| In the text | |
|
Fig. 2 SED of the γ-ray emission toward W40 for a spatially uniform disk model with a radius of 0.46°. Both the statistical and systematic errors for the six low-energy bins are considered. The solid curve represents the spectrum of γ-rays from interactions of relativistic protons with the ambient gas, assuming a power-law distribution of protons (see Sect. 4). The dashed curve represents the predicted fluxes of γ-ray emission derived from the H II column density map, the CRs are assumed to have the same spectra as measured in the solar neighborhood (Aguilar et al. 2015). (For details, see the context in Sect. 3.) The gray data points are the fluxes ofNGC 3603 taken from Yang & Aharonian (2017). |
| In the text | |
|
Fig. 3 Light curve of γ-ray emission towards W40 from August 4, 2008 (MJD 54 683) until April 30, 2019 (MJD 58 604). |
| In the text | |
|
Fig. 4 Maps of gas column densities in three phases, smoothed with a Gaussian kernel of 0.6°. The marks are the same as in Fig. 1. Left: H I column density derived from 21-cm all-sky survey. Middle: H2 column density derived from the CO data. Right: H II column density derived from the Planck free–free map. For details, see the context in Sect. 3. |
| In the text | |
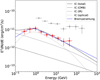 |
Fig. 5 Same as Fig. 2 but for leptonic modeling. |
| In the text | |
|
Fig. 6 TS residual map above 1 GeV overlaid with the rings used to derived upper limits of cosmic ray energy density in Sect. 5. |
| In the text | |
|
Fig. 7 Derived CR density profile near W40. The data points are the γ-ray emission above 1 GeVof W40. The upper limits are derived for the rings defined in Fig. 6. The balck and red curves are the projected 1∕r and 1∕r2 profiles, respectively. |
| In the text | |
Current usage metrics show cumulative count of Article Views (full-text article views including HTML views, PDF and ePub downloads, according to the available data) and Abstracts Views on Vision4Press platform.
Data correspond to usage on the plateform after 2015. The current usage metrics is available 48-96 hours after online publication and is updated daily on week days.
Initial download of the metrics may take a while.