Fig. 4
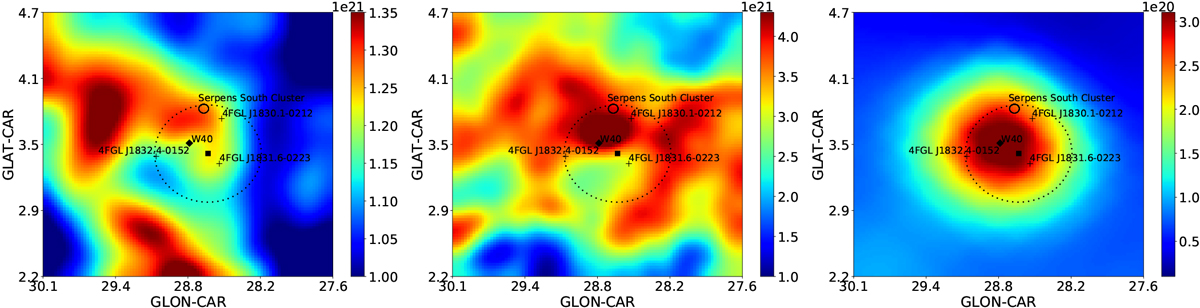
Maps of gas column densities in three phases, smoothed with a Gaussian kernel of 0.6°. The marks are the same as in Fig. 1. Left: H I column density derived from 21-cm all-sky survey. Middle: H2 column density derived from the CO data. Right: H II column density derived from the Planck free–free map. For details, see the context in Sect. 3.
Current usage metrics show cumulative count of Article Views (full-text article views including HTML views, PDF and ePub downloads, according to the available data) and Abstracts Views on Vision4Press platform.
Data correspond to usage on the plateform after 2015. The current usage metrics is available 48-96 hours after online publication and is updated daily on week days.
Initial download of the metrics may take a while.