Free Access
Fig. 7
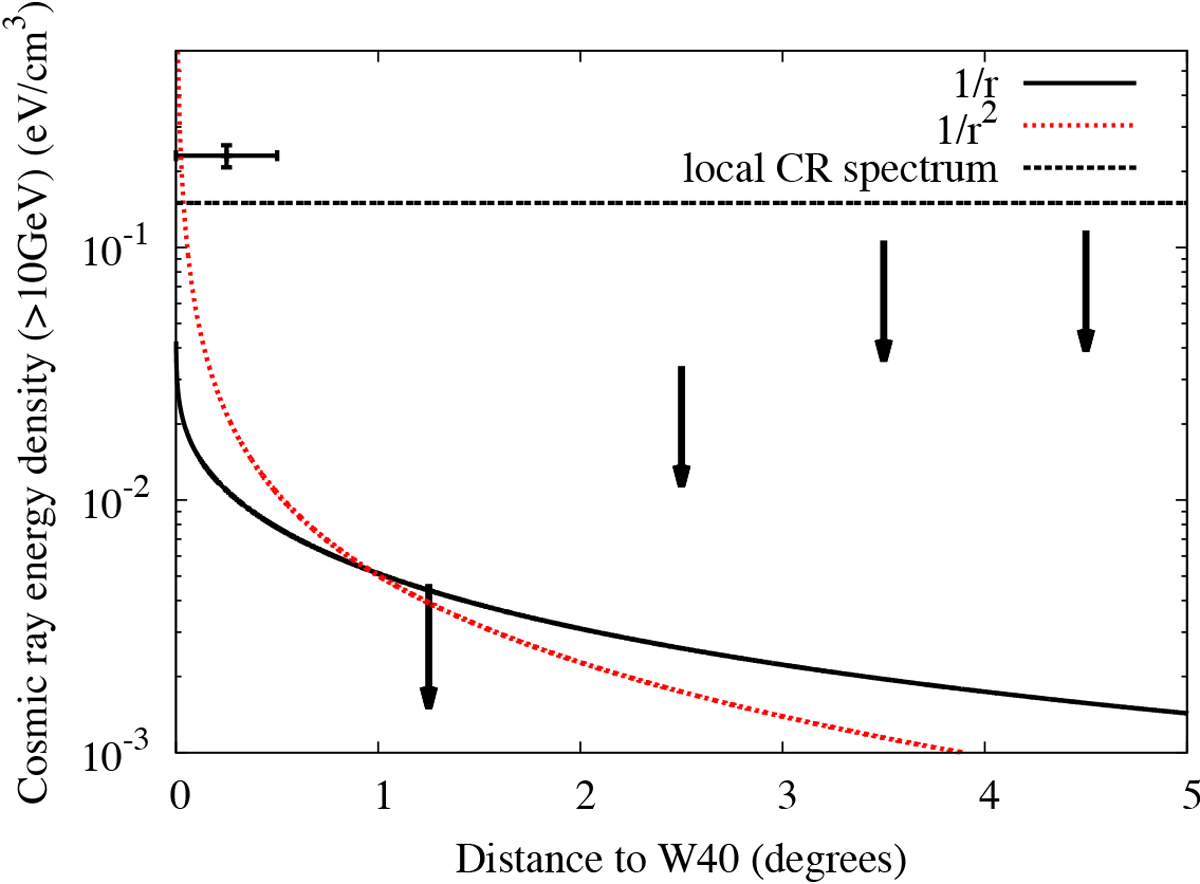
Derived CR density profile near W40. The data points are the γ-ray emission above 1 GeVof W40. The upper limits are derived for the rings defined in Fig. 6. The balck and red curves are the projected 1∕r and 1∕r2 profiles, respectively.
Current usage metrics show cumulative count of Article Views (full-text article views including HTML views, PDF and ePub downloads, according to the available data) and Abstracts Views on Vision4Press platform.
Data correspond to usage on the plateform after 2015. The current usage metrics is available 48-96 hours after online publication and is updated daily on week days.
Initial download of the metrics may take a while.