Fig. 2
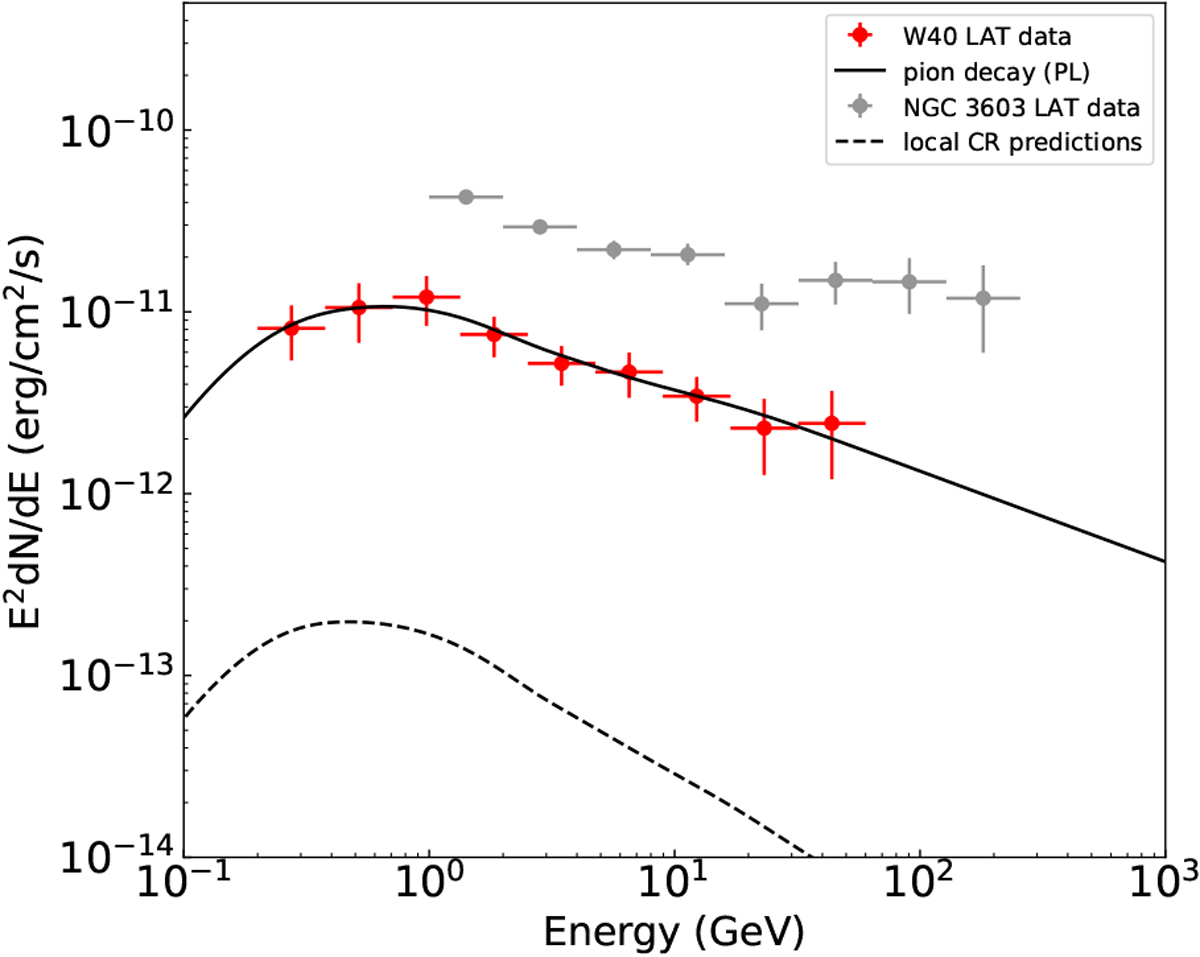
SED of the γ-ray emission toward W40 for a spatially uniform disk model with a radius of 0.46°. Both the statistical and systematic errors for the six low-energy bins are considered. The solid curve represents the spectrum of γ-rays from interactions of relativistic protons with the ambient gas, assuming a power-law distribution of protons (see Sect. 4). The dashed curve represents the predicted fluxes of γ-ray emission derived from the H II column density map, the CRs are assumed to have the same spectra as measured in the solar neighborhood (Aguilar et al. 2015). (For details, see the context in Sect. 3.) The gray data points are the fluxes ofNGC 3603 taken from Yang & Aharonian (2017).
Current usage metrics show cumulative count of Article Views (full-text article views including HTML views, PDF and ePub downloads, according to the available data) and Abstracts Views on Vision4Press platform.
Data correspond to usage on the plateform after 2015. The current usage metrics is available 48-96 hours after online publication and is updated daily on week days.
Initial download of the metrics may take a while.