| Issue |
A&A
Volume 638, June 2020
|
|
|---|---|---|
| Article Number | A35 | |
| Number of page(s) | 6 | |
| Section | Planets and planetary systems | |
| DOI | https://doi.org/10.1051/0004-6361/202037859 | |
| Published online | 08 June 2020 | |
Photometric properties of lunar regolith revealed by the Yutu-2 rover
1
Key Laboratory of Earth and Planetary Physics, Institute of Geology and Geophysics, Chinese Academy of Sciences,
Beijing
100029,
PR China
e-mail: This email address is being protected from spambots. You need JavaScript enabled to view it.
2
State Key Laboratory of Space Weather, National Space Science Center, Chinese Academy of Sciences,
Beijing
100190,
PR China
e-mail: This email address is being protected from spambots. You need JavaScript enabled to view it.
3
Center for Excellence in Comparative Planetology, Chinese Academy of Sciences,
Hefei
230026,
PR China
4
Department of Earth Sciences, University of Hawai‘i at Mānoa,
Honolulu,
HI,
USA
5
State key Laboratory of Remote Sensing Science, Aerospace Information Research Institute, Chinese Academy of Sciences,
Beijing
100101,
PR China
6
Key Laboratory of Space Active Opto-Electronics Technology, Shanghai Institute of Technical Physics, Chinese Academy of Sciences,
Shanghai
200083,
PR China
7
Beijing Aerospace Control Center,
Beijing
100094,
PR China
8
Beijing Institute of Control Engineering,
Beijing
100094,
PR China
Received:
1
March
2020
Accepted:
29
April
2020
Abstract
Context. The surface composition of the Moon has mainly determined based on the visible and near-infrared spectra achieved from orbits and/or landing sites, and the spectroscopic analysis is based on photometric properties of the topmost lunar regolith. However, the lack of a ground truth for the photometric parameters of the undisturbed lunar surface has limited accurate applications of spectral observations.
Aims. Here we report the photometric properties of the small-scale (i.e., centimeter level) undisturbed lunar regolith around the Chang’E-4 landing site, determined from a series of photometric experiments conducted by the rover Yutu-2.
Methods. The simplified Hapke model was used to derive the photometric properties. The micro-topographic effect on the spectral measurements was corrected for the first time in the in situ photometric investigations on the Moon, which improves the accuracy of the derived photometric parameters.
Results. The single-scattering albedo w and two parameters (b, c) of the Henyey-Greenstein phase function were derived, and they show a wavelength dependence. The regolith at the Chang’E-4 landing site exhibits strong forward scattering according to the retrieved c values, and the higher asymmetry parameter indicates that the regolith here is more strongly forward scattering than the Apollo lunar soil samples. The derived photometric parameters can serve as ground truth and can be used in the radiative transfer modeling analysis of the orbital remote-sensing data.
Key words: instrumentation: photometers / planets and satellites: surfaces / infrared: planetary systems / radiative transfer
Equal contributions to this work.
© ESO 2020
1 Introduction
The global and in situ mineral compositions of the lunar surface as well as the space weathering of the lunar soil can be derived from the spectral measurements, with the known photometric properties of the lunar surface, including the porosity K, the single-scattering albedo w, and the two parameters (b, c) of the Henyey-Greenstein phase function. The photometric properties of the lunar surface play key roles in interpreting spectroscopic measurements (e.g., Shkuratov et al. 2011; Hapke 2012a; Jin et al. 2015). Accurate photometric parameters of lunar regolith are essential to characterize its spectroscopic properties and to precisely estimate the mineral abundances. In the past decades, the photometric properties of lunar regolith have been investigated by laboratory measurements of the Apollo lunar samples and simulated samples, Earth-based observations, and orbital remote sensing. For example, a few photometric experiments have been conducted with both synthetic and natural terrestrial granular samples (Mcguire & Hapke 1995; Souchon et al. 2011) and the Apollo samples (Johnson et al. 2013). Although these measurements provided important clues on understanding the photometric properties of lunar regolith, it is difficult to simulate the pristine lunar surface with laboratory measurements. The reflectance data acquired by the Lunar Reconnaissance Orbiter (LRO) have been used to calculate the photometric parameters (Hapke et al. 2012; Sato et al. 2014; Liu et al. 2018) of lunar regolith. Orbital constraints generally do not allow observing a given target with many different viewing geometries (Lin et al. 2020a). Chang’E-3 (CE-3) only acquired four spectra at different sites, which is insufficient to derive the photometric parameters. The three-band panoramic camera (PCAM) images acquired by CE-3 have been used to extract the phase curve and determine the photometric parameters of the lunar surface (Jin et al. 2015), but the lack of measurements at longer wavelengths may have constrained the application of these derived phase functions to other spectroscopic observations. In addition, microtopographic irregularities, which might introduce large uncertainties in the spectral properties of the surface regolith, were ignored in previous studies.
In January 2019, the Chang’E-4 (CE-4) mission successfully landed in the Von Kármán crater within the South-Pole Aitken (SPA) basin, and the rover Yutu-2 has been exploring the lunar surface since then. In order to solve the problems discussed above, the in situ photometric experiments (Fig. 1a) with the Visible and Near-Infrared Imaging Spectrometer (VNIS) on board the Yutu-2 rover were conducted on the tenth lunar day of the mission operations. The spectra of the same area were acquired at different viewing geometries (i.e., incidence angle i, emission angle e, and phase angle g), providing an unprecedented dataset (Fig. 2) and a unique perspective to understand the photometric properties of the lunar surface. TheCE-4 landing site is suggested to be covered by the ejecta from the neighboring Finsen crater (Gou et al. 2019; Hu et al. 2019; Li et al. 2019a; Lin et al. 2020b; Qiao et al. 2019). The digital elevation model (DEM) with a resolution of 5 cm generated using PCAM images indicates that the landing site is about 70 m higher than the mare basalts within the Von Kármán crater (Di et al. 2011). The measurements conducted by the lunar penetrating radar (LPR) on board the Yutu-2 rover suggest an about 11 m thick regolith layer on the top of the crater ejecta (Lai et al. 2019). The modeled age of the landing region is up to 3.6 Ga (e.g., Huang et al. 2018; Ling et al. 2019). The regolith of the uppermost layer may have been churned often enough to be homogenized in composition both vertically and laterally at the landing site. Therefore, the surface at the landing region is likely rather homogeneous in composition, providing an ideal site for conducting a series of photometric experiments. The spectra were acquired at site 1 (Fig. 1b) and site 2 (Fig. 1c). The phase angles of these spectra range from 54.79° to 111.57°. The stereo pair with high spatial resolutions were also acquired during the spectral measurements, which allow us to study the topographic effects on the spectral observations.
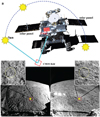 |
Fig. 1 Spectrophotometric measurements of lunar regolith by the Yutu-2 rover. Panel a: illustration of photometric experimentsconducted by the Yutu-2 rover. The VNIS collected spectral data at the same location, but different solar angles. Two adjacent sites were measured in the morning and afternoon, respectively. Panels b and c: images acquired by the hazard-avoidance camera (HAZCAM) at sites 1 and 2, respectively. The red rectangle is the viewing field of the CMOS imager. The inset images within panels b and c show a close-up view of lunar regolith imaged by the CMOS, and the yellow circle is the field of view of SWIR. |
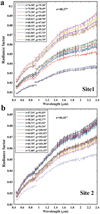 |
Fig. 2 VNIS spectra acquired by Yutu-2. Panel a: site 1 and panel b: site 2. |
2 Data and methods
2.1 VNIS instrument and data preprocessing
The VNIS instrument on board the Yutu-2 rover measures the lunar surface from a height of about 1 m. It has two detectors that includea complementary metal-oxide semiconductor (CMOS) imager and a short-wavelength near-infrared (SWIR) detector (He et al. 2019). The spectral resolution of the CMOS imager is 2.4–6.5 nm from 450 to 945 nm and that of the SWIR detector is 3.6–9.6 nm from 900 to 2395 nm (He et al. 2014; Li et al. 2019b). The spatial calibration between the CMOS and SWIR field was made in the laboratory. The CMOS image is 15 cm × 21 cm, and the SWIR field covers a circular region with a radius of ~3.5 cm within the CMOS image (Fig. 1).
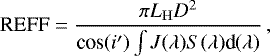
The DN values acquired by the VNIS instrument are converted into radiance data by dark reduction, background removal, thermal correction, and radiometric calibration (He et al. 2014; Liu et al. 2014; Li et al. 2019b). The radiance used in this study was in-flight calibrated using the valid measurements of the Lambertian reference plate on board the rover (Xu et al. 2014). The reflectance (reflectance factor, REFF) was retrieved from radiance by dividing the solar irradiance (Gueymard 2004; Wu et al. 2018),
 (1)
(1)
where J(λ) is the solar irradiance (Gueymard 2004) at wavelength λ, D is the distance between the Sun and the Moon (AU), i′ is the topographically corrected incidence angle (see Sect. 2.2), LH is the measured radiance, and S(λ) is the spectral response of the VNIS sensors.
2.2 Topographic correction
The azimuth angle of the rover location is defined as 0. A right-handed Cartesian coordinate system (XY Z) is used in this work (Fig. 3). The direction toward the rover is defined as the forward direction of the X-axis. In this coordinate system, the incidence vector is [sin(i) × cos(φ), − sin(i) × sin(φ), cos(i)], and the emission vector is [sin(e), 0, cos(e)], where i, e, and φ are the incidence angle, emission angle, and relative azimuth angle between the rover and the Sun, respectively. The local topography affects the normal vector. The slope along the rover observation direction is defined as θ1, and the slope perpendicular to the rover observation direction is defined as θ2. The length of the projection of the normal vector onto the YOZ plane is defined as  , onto the XOZ plane defined as
 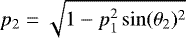 , and onto the Z-axis, it is defined as
  . In this case, the new normal vector that accounts for the local topography can be written as [p2 × sin(θ1), p1 × sin(θ2), p3]. Thus, the corrected incidence angle i′ and the corrected emission angle e′ can be calculated using the vector product principle with the derived new normal vector. The angle between the incidence vector and emission vector is the phase angle g, which does not change with topography. The slope angles can be derived from the DEM (Di et al. 2011), which was generated using the images acquired by the HAZCAM.
2.3 Photometric model for parameter determination
We employed the Hapke model to derive the photometric properties of lunar regolith. The reflectance r (reflectance factor, REFF) can be written as (Hapke 2012b)
![Mathematical equation: \begin{align*}r =&\, \frac{Kw}{4(\mu_0+\mu_e)}\left\{p(g)[1+B_S{}_0B_S(g)]+H\left(\frac{\mu_0}{K}\right)H\left(\frac{\mu_e}{K}\right)-1\right\}\nonumber\\ &\times\,[1+B_C{}_0B_C(g)],\end{align*}](/articles/aa/full_html/2020/06/aa37859-20/aa37859-20-eq6.png) (2)
(2)
where K is the porosity factor, w is the single-scattering albedo, μ0 and μe are the cosines of the incidence angle (i) and emission angle (e), respectively, p(g) is the phase function, BS 0 is the amplitude of the shadow-hiding opposition effect (SHOE) function and BS (g) is the SHOE function, BC 0 is the amplitude of the coherent backscattering opposition effect (CBOE), and BC (g) is the CBOE function, and finally, H(x) is the Ambartsumian-Chandrasekhar H function.
The two-parameter Henyey-Greenstein phase function p (g) was employed,
 (3)
(3)
where b ∈ [0, 1] is the shape-controlling parameter and c is the relative strength of the backward and forward lobes.
The H function is approximated by (Hapke 2012b)
![Mathematical equation: \begin{equation*} H(x) = \frac{1}{1-wx[r_0+\frac{1-2r_0x}{2}\ln{\frac{1+x}{x}}]},\end{equation*}](/articles/aa/full_html/2020/06/aa37859-20/aa37859-20-eq10.png) (4)
(4)
where r0 is the diffusive reflectance, which can be expressed as
 (5)
(5)
The porosity factor K was set to 1.0 because the value of the filling factor of the uppermost layer of the lunar soil is unknown (Hapke et al. 2012; Sato et al. 2014). The value of the SHOE function and COBE are significant only at very small phase angle. The phase angles of all observations in this study are greater than 50°, and we therefore ignored the SHOE and COBE functions. Then Eq. (2) would have three free parameters (w, b, and c). We note that the parameters c and b in the Henyey-Greenstein phase function may be correlated with each other, and they can be expressed as an empirical hockey-stick relation (Hapke 2012a),
 (6)
(6)
This allows us to compare the relationship between the c and b values derived in this study to the hockey-stick relation.
The nonlinear least-squares method was employed to solve Eq. (2). The determination of initial values of the free parameters has significant effects on the final results. Therefore we combined a heuristic piecewise approach and a grid-search method (Hapke et al. 2012; Jin et al. 2015) to fit the phase curves. To avoiding random initial values, we conducted a grid search in parameter space of the free parameters for each model to determine the parameter values of the first band. The lower bounds, steps, and upper bounds were set as w = [0.1, 0.1, 1], b = [0.1, 0.1, 1], and c = [−1, 0.1, 2]. The model fit with the minimum RMSE was accepted. The final parameter values of the band were set as the initial values of the next band. To solve the nonlinear least-squares algorithm, we constrained the values of w and b to between 0 and 1.
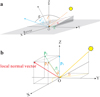 |
Fig. 3 Illustration of viewing geometries and effect of microtopography. Panel a: relations between the viewing angles. i, e, and g are the incidence angle, emission angle, and phase angle, respectively, and i′ and e′ are the incidence and emission angles after topographical correction. θ1 and θ2 are the slope angles along and perpendicular to the rover viewing direction, respectively. Panel b: corrected angles. φ is the relative azimuth angle between the rover and the Sun, p1 is the length of the projection of the normal vector onto the YOZ plane, p2 is the length of the projection of the normal vector onto the XOZ plane, and p3 is the length of the projection of the normal vector onto the Z-axis. |
3 Results and discussions
3.1 Topographic features of the explored area
Of the two sites that were explored on the tenth day of the rover operations, site 1 is located on a sloped surface, whereas site 2 is located at the edge of a small crater, as is shown in the high-resolution images (Fig. 1). The spatial resolution of the derived DEM is better than 2 cm. The slope angles of site 1 are 7.4° and 1.9° in the rover viewing direction and perpendicular to the rover viewing direction, respectively (Fig. 4a). The slope angles of site 2 are − 1.5° and 4.7° tilted in the rover viewing direction and perpendicular to the rover viewing direction, respectively (Fig. 4b). The topographic slopes would bias the true values of the viewing geometry angles, which might affect the spectral properties and thus the geological interpretations. We therefore derived the local viewing geometry angles for all the spectral measurements using the method described in Sect. 2.2 to account for the topographic effects (Fig. 4c). The corrected angles are listed in Table 1.
3.2 Phase curves and photometric parameters of lunar regolith
The reflectance was obtained from the radiance using the solar irradiance calibration method (Eq. (1)). The albedo at the same wavelength changed after topographic correction, indicating that the topography affects the shapes of the phase curves. The phase curves of the representative wavelengths, which were extracted from the spectra, are shown in Fig. 5. Overall, the reflectance increases with increasing wavelength, which is consistent with the reddish spectra of the Moon. This may be caused by space weathering, which produces abundant agglutinates and submicroscopic metallic iron (SMFe; Pieters et al. 2000, 2016). The reflectance values decrease with the increase in phase angles, and then it increases at phase angles greater than 80° (Fig. 5b).
The reflectance variation of the same location at different phase angles in Fig. 5 is dominantly controlled by the phase function of lunar regolith. The phase curves corrected for the topographic effect were fit using the three-parameter (i.e., single-scattering albedo w, phase function parameters b and c) version of Hapke’s model (Eq. (2)) to obtain the photometric parameters. The phase-curve fitting at the representative wavelengths is shown in Fig. 6a. The model gives a high fitting quality with a small root-mean-square error (RMSE). Most RMSE values are lower than 10−2. However, the curve fitting seems worse at longer wavelengths, likely because the reflectance increases, the noise level is higher, and because of thermal emission at longer wavelengths. The strongest deviation between the observed and modeled values occurs at a phase angle of 80° (Fig. 6a), which might be caused by the effects of the shadows caused by the low solar altitude.
The discontinuities in CE-4 spectra and in these Hapke parameters are caused by the differences between the spectral responses of the CMOS and SWIR detectors.The differences between the CMOS and the SWIR measurements over 900–945 nm may vary with the change of measurement geometries. We therefore carried out photometric modeling of the CMOS and SWIR data separately. As shown in Fig. 6, the results suggest that these parameters are wavelength dependent. The single-sattering albedo of the regolith derived from the spectral measurement before and after topographic correction is similar in the CMOS bands, whereas the variations of single-scattering albedo at longer wavelength are evident (Fig. 6b). The phase function parameters b and c show large variations before and after topographic correction. Interestingly, the relations between b and c for the uncorrected and corrected case are not consistent with those derived in laboratory measurements (Fig. 7), although the corrected case is closer to the L-shaped region (i.e, to the hockey-stick relation). The c values are comparable with the Aplollo samples, but the b values are much higher, suggesting that the scattered lobes of the pristine lunar surface are higher and narrower. The scattering properties of the samples vary with the grain sizes, shapes, the state of sample compaction, etc. (Shepard & Helfenstein 2007; Souchon et al. 2011). It is difficult to simulate thestacking structure of the lunar surface, such as the fairy-castle structure (Jaffe 1965), with laboratory samples. The phase curves show that light is more scattered at large phase angles after topographic correction (Fig. 5), indicating strong forward-scattering properties of the regolith. This is consistent with the negative c values in the Henyey-Greenstein phase function (e.g., Hapke 2012a). The regolith at the CE-4 landing site exhibits forward scattering that is similar to that of the Apollo samples (Johnson et al. 2013) (Fig. 7). When the fitted b and c values are used, the asymmetry parameter ⟨cos θ⟩ = −b × c (Hapke 2012b) can be obtained. The asymmetry parameter of CE-4 (0.39 ± 0.06) is larger than those of the Apollo samples (0.12 ± 0.02), suggesting a stronger forward-scattering lobe (Fig. 7). We note that the asymmetry parameters between CE-3 and CE-4 are also differnent, although they were both derived from the measurements of undisturbed regolith. Several factors may have caused this difference. First, the composition of the CE-3 and CE-4 landing sites is different. The regolith at the CE-3 landing site is high-titanium basalt, while that at the CE-4 landing site may consist of norite (Lin et al. 2020b). Second, the difference in space-weathering degree may have caused the difference. The CE-4 landing area (~3.6 Ga) is older than that of CE-3 (~2.96 Ga), indicating that the regolith at the CE-4 landing area is more mature (Huang et al. 2018). Alternatively, the difference might be due to the photometric measurement method. The photometric data of CE-3 were obtained using the panorama camera (PCAM), which covers a large circular area (~20 m diameter) (Jin et al. 2015), where the measurements were not repeatedly conducted over the same area. In contrast, the VNIS instrument on board the Yutu-2 rover of CE-4 measured exactly the same area under varied viewing geometries, which essentially provided more reliable photometeric measurements. The photometric parameters derived from these in situ measurements provide important insight on the scattering properties of the lunar regolith. Our analysis also indicates that the topography has strong effects on the photometric values derived from the in situ spectral measurements of the lunar regolith, and these effects need to be corrected for. The photometric parameters to which the topographic correction is applied are critical for obtaining more accurate information on the mineral abundance at the landing site. The wavelength-dependent b and c values in the two-parameter Henyey-Greenstein phase function, derived from CE-4 in situ meaurements, can serve as ground truth and can be used in the radiative transfer modeling analysis of the orbital remote-sensing data.
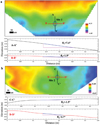 |
Fig. 4 Microtopographic features of explored area and the corrected measurement angles. Panel a: DEM generated using the images acquired by HAZCAM at site 1. The context of the region is shown in Fig. 1b. Topographic profiles from A to A′ and B to B′ are indicated. Panel b: DEM generated using the images acquired by HAZCAM at site 2. The context of the region is shown in Fig. 1c. Topographic profiles from C to C′ and D to D′ are also indicated. The blue line is the field of view of SWIR. |
Incidence angle, emission angle, and phase angle of all measurements for the original and the corrected angles that take the topography into account.
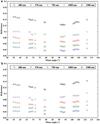 |
Fig. 5 Phase curves at five different wavelengths derived from in situ spectral observations. Panel a: variation of the reflectance with phase angles at representative wavelengths derived from spectral measurements at a wide range of phase angles from 54.79° to 111.57°. Panel b: same dataset as in panel a, but after correction for the microtopography effect. |
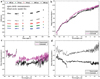 |
Fig. 6 Derived Hapke model parameters of lunar regolith. Panel a: model fits of the phase curves at 480, 570, 750, 1000, and 1580 nm. The open circles show measurements, and the solid circles show the modeled values. Panel b: variation of the single-scattering albedo w with wavelength. Panel c: variation of the phase function parameter b with wavelength. Panel d: variation of the phase function parameter c with wavelength. |
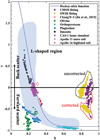 |
Fig. 7 Relation between phase function parameters b and c (modified from Sato et al. 2014). The phase function parameters of pure minerals were calculated using the data in Yang et al. (2018). We show the lunar simulated regolith (Zheng et al. 2009; Lin et al. 2020b), and regolith at the Chang’E-3 landing site as well as Apollo soil (Johnson et al. 2013) for comparison. The areas marked with the dashed black and red lines arethe data points derived using the CE-4 reflectance without and with topographic correction, respectively. |
4 Conclusions
A series of in situ photometric measurements were conducted by the Yutu-2 rover. They provide an excellent opportunity to study the photometric properties of the lunar regolith. Microtopographic correction was performed on these measurements, and the phase curves were derived. We then estimated the single-scattering albedo w and two parameters b and c in the two-parameter Henyey-Greenstein phase function using the simplified Hapke model. Our results show that these parameters show a strong wavelength dependence. The regolith at the CE-4 landing site exhibits forward scattering based on the negative c values. Compared to the Apollo samples, the regolith at the CE-4 landing site has stronger forward scattering, as indicated by the higher asymmetry parameter. The derived photometric parameters are critical for a quantitative analysis of the mineral abundances at the landing site from the VNIR spectra collected in situ, and they also provide critical ground truth for the photometric correction of orbital data.
Acknowledgements
The Chang’E-4 mission was carried out by the Chinese Lunar Exploration Program, and the data was provided by the Science and Application Center for Moon and Deep Space Exploration, Chinese Academy of Sciences. We thank Stéphane Le Mouélic for the constructive comments that significantly improved the content and clarity of the manuscript. This work was supported by the Strategic Priority Research Program of Chinese Academy of Sciences (Grant No. XDB 41000000), the National Natural Science Foundation of China (41902318, 11941001, 41490631, and 41525016), the Key Research Program of Frontier Sciences, CAS (QYZDJ-SSW-DQC001), the pre-research project on Civil Aerospace Technologies (No. D020101 and D020102) funded by China National Space Administration (CNSA) and the Beijing Municipal Science and Technology Commission (Z181100002918003 and Z191100004319001). H. Lin also thanks the support of the Key Research Program of the Institute of Geology and Geophysics, CAS (IGGCAS-201905) and Y. Yang acknowledges the support from the China Postdoctoral Science Foundation (No. 2019TQ0323). The data reported in this work are archived at http://moon.bao.ac.cn. The authors declare no competing interests.
References
- Di, K., Zhu, M. H., Yue, Z., et al. 2019, Geophys. Res. Lett., 46, 12764 [NASA ADS] [CrossRef] [Google Scholar]
- Gou, S., Di, K., Yue, Z., et al. 2019, Earth Planet. Sci. Lett., 528, 115829 [CrossRef] [Google Scholar]
- Gueymard, C. A. 2004, Sol. Energy, 76, 423 [NASA ADS] [CrossRef] [Google Scholar]
- Hapke, B. 2012a, Icarus, 221, 1079 [NASA ADS] [CrossRef] [Google Scholar]
- Hapke, B. 2012b, Theory of Reflectance and Emittance Spectroscopy (Cambridge: Cambridge University Press) [Google Scholar]
- Hapke, B., Denevi, B., Sato, H., et al. 2012, J. Geophys. Res. Planet, 117 [Google Scholar]
- He, Z., Wang, B., Lu, G., et al. 2014, Res. A&A, 14, 1567 [NASA ADS] [Google Scholar]
- He, Z., Li, C., Xu, R., et al. 2019, J. Appl. Remote Sens., 13, 027502 [NASA ADS] [CrossRef] [Google Scholar]
- Hu, X., Ma, P., Yang, Y., et al. 2019, Geophys. Res. Lett., 46, 9439 [NASA ADS] [CrossRef] [Google Scholar]
- Huang, J., Xiao, Z., Flahaut, J., et al. 2018, J. Geophys. Res. Planet, 123, 1684 [NASA ADS] [CrossRef] [Google Scholar]
- Jaffe, L. 1965, J. Geophys. Res, 70, 6268 [NASA ADS] [CrossRef] [Google Scholar]
- Jin, W., Zhang, H., Yuan, Y., et al. 2015, Geophys. Res. Lett., 42, 8312 [NASA ADS] [CrossRef] [Google Scholar]
- Johnson, J. R., Shepard, M. K., Grundy, W. M., et al. 2013, Icarus, 223, 383 [NASA ADS] [CrossRef] [Google Scholar]
- Lai, J., Xu, Y., Zhang, X., et al. 2019, Geophys. Res. Lett., 46, 12783 [NASA ADS] [CrossRef] [Google Scholar]
- Li, C., Liu, D., Liu, B., et al. 2019a, Nature, 569, 378 [NASA ADS] [CrossRef] [Google Scholar]
- Li, C., Xu, R., Lv, G., et al. 2019b, Rev. Sci. Instrum, 90, 103106 [NASA ADS] [CrossRef] [Google Scholar]
- Lin, H., Xu, R., Yang, W., et al. 2020a, J. Geophys. Res. Planets, 125, e2019JE006076 [NASA ADS] [CrossRef] [Google Scholar]
- Lin, H., He, Z., Yang, W., et al. 2020b, Natl. Sci. Rev., 7, 913 [NASA ADS] [CrossRef] [Google Scholar]
- Ling, Z., Qiao, L., Liu, C., et al. 2019, Planet Space Sci., 179, 104741 [CrossRef] [Google Scholar]
- Liu, B., Li, C., Zhang, G., et al. 2014, Res. A&A, 14, 1578 [NASA ADS] [Google Scholar]
- Liu, Y., Retherford, K., Greathouse, T., et al. 2018, J. Geophys. Res. Planets, 123, 2550 [NASA ADS] [CrossRef] [Google Scholar]
- Mcguire, A., & Hapke, B. 1995, Icarus, 113, 134 [NASA ADS] [CrossRef] [Google Scholar]
- Pieters, C., & Noble, S. 2016, J. Geophys. Res. Planets, 121, 1865 [CrossRef] [Google Scholar]
- Pieters, C., Taylor, L., Noble, S., et al. 2000, Meteorit. Planet. Sci., 35, 1101 [NASA ADS] [CrossRef] [Google Scholar]
- Qiao, L., Ling, Z., Fu, X., et al. 2019, Icarus, 333, 37 [NASA ADS] [CrossRef] [Google Scholar]
- Sato, H., Robinson, M., Hapke, B., et al. 2014, J. Geophys. Res. Planets, 119, 1775 [NASA ADS] [CrossRef] [Google Scholar]
- Shepard, M., & Helfenstein, P. 2007, J. Geophys. Res. Planets, 112, E3 [NASA ADS] [CrossRef] [Google Scholar]
- Shkuratov, Y., Kaydash, V., Korokhin, V., et al. 2011, Planet Space Sci., 59, 1326 [CrossRef] [Google Scholar]
- Souchon, A., Pinet, P., Chevrel, S., et al. 2011, Icarus, 215, 313 [NASA ADS] [CrossRef] [Google Scholar]
- Wu, Y., Wang, Z., Cai, W., et al. 2018, AJ, 155, 213 [NASA ADS] [CrossRef] [Google Scholar]
- Xu, R., Lv, G., Ma, Y., et al. 2014, SPIE Conf. Ser., 926315 [Google Scholar]
- Yang, Y., Li, S., Milliken, R., et al. 2018, J. Geophys. Res. Planets, 124, 31 [NASA ADS] [Google Scholar]
- Zheng, Y., Wang, S., Ouyang, Z., et al. 2009, Adv. Space Res., 43, 448 [NASA ADS] [CrossRef] [Google Scholar]
All Tables
Incidence angle, emission angle, and phase angle of all measurements for the original and the corrected angles that take the topography into account.
All Figures
|
Fig. 1 Spectrophotometric measurements of lunar regolith by the Yutu-2 rover. Panel a: illustration of photometric experimentsconducted by the Yutu-2 rover. The VNIS collected spectral data at the same location, but different solar angles. Two adjacent sites were measured in the morning and afternoon, respectively. Panels b and c: images acquired by the hazard-avoidance camera (HAZCAM) at sites 1 and 2, respectively. The red rectangle is the viewing field of the CMOS imager. The inset images within panels b and c show a close-up view of lunar regolith imaged by the CMOS, and the yellow circle is the field of view of SWIR. |
| In the text | |
|
Fig. 2 VNIS spectra acquired by Yutu-2. Panel a: site 1 and panel b: site 2. |
| In the text | |
|
Fig. 3 Illustration of viewing geometries and effect of microtopography. Panel a: relations between the viewing angles. i, e, and g are the incidence angle, emission angle, and phase angle, respectively, and i′ and e′ are the incidence and emission angles after topographical correction. θ1 and θ2 are the slope angles along and perpendicular to the rover viewing direction, respectively. Panel b: corrected angles. φ is the relative azimuth angle between the rover and the Sun, p1 is the length of the projection of the normal vector onto the YOZ plane, p2 is the length of the projection of the normal vector onto the XOZ plane, and p3 is the length of the projection of the normal vector onto the Z-axis. |
| In the text | |
|
Fig. 4 Microtopographic features of explored area and the corrected measurement angles. Panel a: DEM generated using the images acquired by HAZCAM at site 1. The context of the region is shown in Fig. 1b. Topographic profiles from A to A′ and B to B′ are indicated. Panel b: DEM generated using the images acquired by HAZCAM at site 2. The context of the region is shown in Fig. 1c. Topographic profiles from C to C′ and D to D′ are also indicated. The blue line is the field of view of SWIR. |
| In the text | |
|
Fig. 5 Phase curves at five different wavelengths derived from in situ spectral observations. Panel a: variation of the reflectance with phase angles at representative wavelengths derived from spectral measurements at a wide range of phase angles from 54.79° to 111.57°. Panel b: same dataset as in panel a, but after correction for the microtopography effect. |
| In the text | |
|
Fig. 6 Derived Hapke model parameters of lunar regolith. Panel a: model fits of the phase curves at 480, 570, 750, 1000, and 1580 nm. The open circles show measurements, and the solid circles show the modeled values. Panel b: variation of the single-scattering albedo w with wavelength. Panel c: variation of the phase function parameter b with wavelength. Panel d: variation of the phase function parameter c with wavelength. |
| In the text | |
|
Fig. 7 Relation between phase function parameters b and c (modified from Sato et al. 2014). The phase function parameters of pure minerals were calculated using the data in Yang et al. (2018). We show the lunar simulated regolith (Zheng et al. 2009; Lin et al. 2020b), and regolith at the Chang’E-3 landing site as well as Apollo soil (Johnson et al. 2013) for comparison. The areas marked with the dashed black and red lines arethe data points derived using the CE-4 reflectance without and with topographic correction, respectively. |
| In the text | |
Current usage metrics show cumulative count of Article Views (full-text article views including HTML views, PDF and ePub downloads, according to the available data) and Abstracts Views on Vision4Press platform.
Data correspond to usage on the plateform after 2015. The current usage metrics is available 48-96 hours after online publication and is updated daily on week days.
Initial download of the metrics may take a while.