| Issue |
A&A
Volume 636, April 2020
|
|
|---|---|---|
| Article Number | L11 | |
| Number of page(s) | 4 | |
| Section | Letters to the Editor | |
| DOI | https://doi.org/10.1051/0004-6361/202038072 | |
| Published online | 28 April 2020 | |
Letter to the Editor
Fast degradation of the circular flare ribbon on 2014 August 24⋆
1
Key Laboratory of Dark Matter and Space Science, Purple Mountain Observatory, CAS, Nanjing 210033, PR China
e-mail: This email address is being protected from spambots. You need JavaScript enabled to view it.
2
CAS Key Laboratory of Solar Activity, National Astronomical Observatories, Chinese Academy of Sciences, Beijing 100101, PR China
3
School of Astronomy and Space Science, University of Chinese Academy of Sciences, Beijing 100049, PR China
Received:
2
April
2020
Accepted:
14
April
2020
Abstract
Context. The separation and elongation motions of solar flare ribbons have extensively been investigated. The degradation and disappearance of ribbons have rarely been explored.
Aims. We report our multiwavelength observations of a C5.5 circular-ribbon flare associated with two jets (jet1 and jet2) on 2014 August 24, focusing on the fast degradation of the outer circular ribbon (CR).
Methods. The flare was observed in ultraviolet (UV) and extreme-ultraviolet (EUV) wavelengths by the Atmospheric Imaging Assembly (AIA) on board the Solar Dynamics Observatory spacecraft. Soft X-ray fluxes of the flare in 0.5−4 and 1−8 Å were recorded by the GOES spacecraft.
Results. The flare, consisting of a short inner ribbon (IR) and outer CR, was triggered by the eruption of a minifilament. The brightness of IR and outer CR reached their maxima simultaneously at ∼04:58 UT in all AIA wavelengths. Subsequently, the short eastern part of the CR faded out quickly in 1600 Å but only gradually in EUV wavelengths. The long western part of the CR degraded in the counterclockwise direction and decelerated. The degradation was distinctly divided into two phases: phase I with faster apparent speeds (58−69 km s−1), and phase II with slower apparent speeds (29−35 km s−1). The second phase stopped at ∼05:10 UT when the western CR disappeared entirely. In addition to the outward propagation of jet1, the jet spire experienced untwisting motion in the counterclockwise direction during 04:55−05:00 UT.
Conclusions. We conclude that the event can be explained by the breakout jet model. The coherent brightenings of the IR and CR at ∼04:58 UT may result from the impulsive interchange reconnection near the null point, whereas sub-Alfvénic slipping motion of the western CR in the counterclockwise direction indicates the occurrence of slipping magnetic reconnection. Another possible explanation of the quick disappearance of the hot loops that are connected to the western CR is that they are simply reconnected sequentially without the need for significant slippage after the null-point reconnection.
Key words: Sun: flares / Sun: UV radiation / Sun: X-rays, gamma rays / Sun: magnetic fields / Sun: filaments, prominences
Movies associated to Figs. 2 and 3 are available at https://www.aanda.org
© ESO 2018
1. Introduction
Solar flares are one of the most powerful activities in the solar atmosphere (Fletcher et al. 2011). An amount of 1029−1032 erg magnetic free energy is impulsively released through magnetic reconnection within tens of minutes to a few hours (Emslie et al. 2012; Yang et al. 2015; Li et al. 2017a; Chen et al. 2019a; Hong et al. 2019; Zhang et al. 2019a). In the context of the collisional thick-target flare model, high-energy electrons stream downward into the cool and dense chromosphere where electrons are stopped by Coulomb collisions and lose energy, heating the localized plasma to ∼107 K and driving chromospheric evaporation (Brown 1971; Fisher et al. 1985). Emissions at the flare ribbons or kernels increase dramatically in optical, ultraviolet (UV), extreme-ultraviolet (EUV), hard X-ray (HXR), and microwave wavelengths (e.g., Krucker et al. 2011; Fletcher et al. 2013; Sharykin & Kosovichev 2014; Jing et al. 2016; Chen et al. 2019b). After reaching the peak value, the ribbon brightness begins to decrease as a result of conductive and radiative cooling (Cargill et al. 1995).
As magnetic reconnection in the corona proceeds, the double flare ribbons separate with time (Qiu et al. 2002, 2004). The reconnection rate can be estimated based on the separation speed (20−100 km s−1) and line-of-sight (LOS) magnetic field strength on the conjugate ribbons. High-cadence and high-resolution observations reveal that the distance between the double centroids of Hα bright kernels decreases in the rising phase of the HXR spikes and increases after the flare peak time (Ji et al. 2004, 2006). In addition to the separation, the brightening may propagate along the flare ribbons at speeds of a few to 100 km s−1 (Qiu 2009; Qiu et al. 2017). During three-dimensional (3D) magnetic reconnection within the thin quasi-separatrix layer (QSL; Demoulin et al. 1996) where the gradient in field-line linkage is sharp and electric current accumulates, the flare ribbons propagate along the intersection of the QSL with the photosphere (e.g., Aulanier et al. 2007; Janvier et al. 2013, 2016; Li & Zhang 2015; Savcheva et al. 2016; Zhao et al. 2016).
Circular-ribbon flares (CRFs) are a special type of flares whose ribbons have circular or quasi-circular shapes (e.g., Masson et al. 2009; Wang & Liu 2012; Hernandez-Perez et al. 2017; Li et al. 2018; Chen et al. 2019b; Hou et al. 2019). In most cases, they are triggered by filament eruptions (Yang & Zhang 2018; Li & Yang 2019). The 3D magnetic configuration associated with a CRF usually features a magnetic null point and the corresponding fan-spine skeleton (Xu et al. 2017; Li & Yang 2019). The inner ribbon (IR) is shorter and brighter than the outer circular ribbon (CR), implying that the energy deposition is more concentrated in the IR (Zhang et al. 2016a,b). The chromospheric brightening of a CRF is not always simultaneous but is sequential, with apparent speeds of 10–220 km s−1 (Wang & Liu 2012; Li et al. 2017b, 2018; Romano et al. 2017; Xu et al. 2017). So far, the degradation and disappearance of flare ribbons have rarely been investigated.
In this paper, we report our multiwavelength observations of the C5.5 CRF on 2014 August 24, focusing on the fast degradation of the outer CR. In Sect. 2 we describe the data analysis. Results are presented in Sect. 3. We compare our findings with previous models and give a brief summary in Sect. 4.
2. Observations and data analysis
The C5.5 flare in NOAA active region (AR) 12149 (N10E44) was observed by the Atmospheric Imaging Assembly (AIA; Lemen et al. 2012) on board the Solar Dynamics Observatory (SDO). AIA takes full-disk images in two UV (1600 and 1700 Å) and seven EUV (94, 131, 171, 193, 211, 304, and 335 Å) wavelengths. The level_1 data were calibrated using the standard solar software program aia_prep.pro. Soft X-ray (SXR) light curves of the flare in 0.5−4 and 1−8 Å were recorded by the GOES spacecraft. The observational parameters are listed in Table 1.
Description of the observational parameters.
3. Results
The bottom panel of Fig. 1 shows the SXR light curves of the flare. It is clear that the SXR emissions started to rise at ∼04:55 UT and reached peak values at ∼05:02 UT, which were followed by a gradual decay phase until ∼05:25 UT. Because the HXR flux during the flare was not available, we took a time derivative of the 1−8 Å flux as a HXR proxy according to the Neupert effect. In Fig. 1a, two spikes at 04:58:36 UT and 04:59:18 UT are remarkable, which are concurrent with the primary and second peaks in 1600 Å (see Fig. 1d in Zhang et al. (2019b)). A plausible reason for these spikes is intermittent magnetic reconnection and subsequent energy input in the chromosphere by nonthermal electrons (Zhang et al. 2016b).
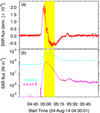 |
Fig. 1. Bottom panel: SXR light curves of the C5.5 flare in 0.5−4 Å (magenta line) and 1−8 Å (cyan line). Top panel: time derivative of the 1−8 Å flux. In each panel, the yellow region stands for the time of fast degradation of the outer CR. |
In Fig. 2, eight snapshots of the AIA 304 Å images illustrate the flare evolution (see also the online animation anim304.mov). Before the flare, there were three minifilaments (F1, F2, and F3) at the flaring region. The impulsive eruption of the eastern filament (F1) resulted in strong heating of the filament and generation of the first blowout jet (jet1) (see panels b–c). At this time, magnetic reconnection at the null point may be triggered (Priest & Pontin 2009; Zhang et al. 2012; Baumann et al. 2013). The accelerated nonthermal electrons propagate downward along the fan-spine field lines and precipitate into the chromosphere. The impulsive heating results in the CRF, which consists of a compact IR and the surrounding CR. The brightness of IR and CR reached their maxima at ∼04:58 UT. Shortly afterward, another jet (jet2) appeared adjacent to jet1 and propagated northward (see panel d). Subarcsecond blobs (plasmoids) with an average size of 0 78 were detected in the jets (Zhang & Ni 2019). The southern minifilament (F2) and western minifilament (F3) were undisturbed and remained there (see panels d–h).
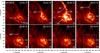 |
Fig. 2. Eight snapshots of the AIA 304 Å images during 04:50−05:18 UT. The white arrows point to the CR, IR, two jets (jet1 and jet2), and three filaments (F1, F2, and F3). Two slices (S1 and S2) in panel c are used to investigate the propagation and rotation of jet1. The white dashed box in panel h shows the field of view of Fig. 3. The flare evolution is shown in a movie (anim304.mov) that is available online. |
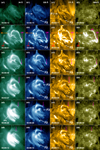 |
Fig. 3. Evolution of the flare ribbons observed in AIA 94 Å (a1–a6), 335 Å (b1–b6), 171 Å (c1–c6), and 1600 Å (d1–d6). The white arrows point to F1, F2, F3, and the PFL. The orange arrows point to the IR. The red and magenta arrows point to the eastern and western parts of the CR, respectively. The CR evolution is shown in a movie (animrb.mov) that is available online. |
In Fig. 3, the left column (a1–a6) shows the evolution of flare ribbons in 94 Å (logT ≈ 6.8). A bright post-flare loop (PFL) became evident as magnetic reconnection proceeded. During 04:58−05:04 UT, converging motion of hot plasma along the PFL towards the loop top was detected, which is a clear indication of chromospheric evaporation (Zhang et al. 2019b). The second, third, and fourth columns of Fig. 3 show the evolution of ribbons in 335 Å (logT ≈ 6.4), 171 Å (logT ≈ 5.8), and 1600 Å, respectively. As mentioned above, the brightness of the IR and the outer CR reached their maxima simultaneously at ∼04:58 UT in all AIA wavelengths, which is consistent with the HXR peak time (see Fig. 1a). Subsequently, the short eastern part of the CR, which is pointed by the red arrows, faded out quickly in 1600 Å (see panels d2–d6) but only gradually in EUV wavelengths. The long western part of CR, which is pointed out by the magenta arrows, did not fade out coherently as expected. Instead, the CR degraded in the counterclockwise direction during 04:58−05:10 UT.
In Fig. 3d2, a curved artificial slice (S0) along the western CR is selected. The time-distance diagrams of S0 in various wavelengths are displayed in Fig. 4. It is obvious that the CR brightened simultaneously at ∼04:58 UT in all wavelengths. Then, the CR degraded counterclockwise and experienced a deceleration. The degradation was clearly divided into two phases: phase I with faster apparent speeds (58−69 km s−1), and phase II with slower apparent speeds (29−35 km s−1). The average speed of phase I is ∼2.1 times higher than that of phase II. The second phase stopped at ∼05:10 UT when the western CR disappeared entirely (see Table 2).
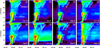 |
Fig. 4. Time-distance diagrams of S0 in various wavelengths, showing the fast degradation of the western CR during 04:58−05:10 UT. The apparent speeds are labeled. s = 0 and |

Apparent speeds (km s−1) of the degradation of the western CR in different AIA wavelengths (Å).
4. Discussion and summary
To explain how accelerated particles at a reconnection site might finally propagate along the Earth-connected open flux tube, Masson et al. (2012) performed a 3D numerical simulation under the magnetic topology of an asymmetric coronal null point, with a closed fan surface and an open outer spine. They found that interchange magnetic reconnection takes place when field lines anchored below the fan dome reconnect at the null point and jump to the open magnetic domain. The reconnected field lines near the outer spine continue to reconnect and show apparent slipping motion, which is quite different from the case in 2D. Recently, Wyper et al. (2018) performed 3D numerical simulations of coronal jets with filaments, confirming the breakout jet generation mechanism (Wyper et al. 2017). The untwisting blowout jets are produced by a combination of an untwisting flux rope and plasma accelerated by the flare reconnection below. Doyle et al. (2019) studied a helical jet associated with a C1.5 flare triggered by a confined filament eruption on 2013 June 30. The erupting filament material was partially transferred into the outflow jet along large-scale overlying coronal loops. Additionally, the authors conducted a 3D magnetohydrodynamical numerical simulation of a breakout jet in a closed-field configuration and found excellent qualitative agreement with observations. Based on this, they concluded that the confined eruption with a rotating jet might well be explained by the breakout model (Wyper et al. 2017, 2018).
In our study, the first jet (jet1) associated with the C5.5 CRF also shows untwisting motion. In Fig. 2c, two artificial slices (S1 and S2) along and across the jet spire are selected. The time-distance diagrams of S1 and S2 in 304 Å are displayed in the left and right panels of Fig. 5, respectively. The apparent propagation speed of jet1 during 04:55−05:00 UT is calculated to be ∼300 km s−1. In panel b, the jet spire clearly shows untwisting motion in the counterclockwise direction when looking down and splits into two threads during 04:55−05:00 UT. The apparent speeds of untwisting motion are estimated to be ∼59 and ∼63 km s−1. It is noted that jet2 does not show significant rotation, possibly because the twist (helicity) in the erupting filament (F1) has entirely been transported to the large-scale coronal loops during jet1. Therefore, the CRF associated with an untwisting jet triggered by the eruption of a minifilament can be interpreted by the breakout model (Wyper et al. 2018). The coherent brightenings of the IR and CR at ∼04:58 UT may result from the impulsive interchange reconnection near the null point, whereas sub-Alfvénic slipping motion of the western CR in the counterclockwise direction is indicative of slipping magnetic reconnection. The apparent speeds of degradation are close to the speeds of elongation of the CR during the second episode in the event of Li et al. (2018). The deceleration of degradation from phase I to phase II suggests that magnetic reconnection tapered off.
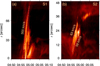 |
Fig. 5. Time-distance diagrams of S1 and S2 in 304 Å. The apparent speeds are labeled. Panel a: s = 0 and s = 99″ on the y-axis denote the southern and northern endpoints of S1. Panel b: s = 0 and s = 48″ on the y-axis denote the eastern and western endpoints of S2. |
It is revealed in the breakout jet model that the magnetic flux of strapping field overlying the erupting filament is transferred to the other side of the fan dome, allowing the filament to reach the null point, where it is reconnected and produces a helical jet. Meanwhile, a flare current sheet is formed beneath the filament, so that the reconnected overlying flux is reconnected back to the origin of the filament. In Fig. 3a3, hot newly reconnected loops appeared, connecting to the western CR. These hot loops might be the breakout loops on the other side of F1 (see also Fig. 9b in Doyle et al. 2019). The sequential disappearance of these hot loops during 04:58−05:04 UT is not only concurrent with the fast degradation of western CR in phase I, but also consistent with the brightening of PFL to the east side of the anemone (see Figs. 3a4–a6). The evolution is clearly illustrated in Fig. 9 of Doyle et al. (2019) and agrees well with the breakout jet model by Wyper et al. (2018). Therefore, another possible explanation of the quick disappearance of the hot loops connected to the western CR is that they are simply reconnected sequentially without the need for significant slippage after the null-point reconnection.
We report our multiwavelength observations of a C5.5 CRF associated with two jets on 2014 August 24. The flare, consisting of a short IR and outer CR, was triggered by the eruption of a minifilament. The brightness of IR and CR reached their maxima simultaneously at ∼04:58 UT in all AIA wavelengths. Afterward, the short eastern part of CR faded out quickly in 1600 Å but only gradually in EUV wavelengths. The long western part of CR degraded in the counterclockwise direction and decelerated. The degradation was distinctly divided into two phases: phase I with faster apparent speeds (58−69 km s−1), and phase II with slower apparent speeds (29−35 km s−1). The second phase stopped at ∼05:10 UT when the western CR disappeared completely. In addition to the longitudinal propagation of jet1, the jet spire experienced untwisting motion in the counterclockwise direction during 04:55−05:00 UT. We conclude that the analysis of this event is in favor of the breakout jet model. The coherent brightenings of the IR and CR at ∼04:58 UT may result from the impulsive interchange reconnection near the null point, whereas sub-Alfvénic slipping motion of the western CR in the counterclockwise direction indicates the occurrence of slipping magnetic reconnection.
Movies
Movie of Fig. 2 Access Supplementary Material
Movie of Fig. 3 Access Supplementary Material
Acknowledgments
The authors appreciate the referee for valuable suggestions and comments. We also thank K. Yang for discussions. SDO is a mission of NASA’s Living With a Star Program. AIA data are courtesy of the NASA/SDO science teams. This work is funded by NSFC grants (No. 11773079, 11790302, 11673035, 11773039, 11903050, 11790304, 11873095), the International Cooperation and Interchange Program (11961131002), the Youth Innovation Promotion Association CAS, the Science and Technology Development Fund of Macau (275/2017/A), the Strategic Priority Research Program on Space Science, CAS (XDA15052200, XDA15320301), CAS Key Laboratory of Solar Activity, National Astronomical Observatories (KLSA202006), and the project supported by the Specialized Research Fund for State Key Laboratories.
References
- Aulanier, G., Golub, L., DeLuca, E. E., et al. 2007, Science, 318, 1588 [NASA ADS] [CrossRef] [Google Scholar]
- Baumann, G., Haugbølle, T., & Nordlund, Å. 2013, ApJ, 771, 93 [NASA ADS] [CrossRef] [Google Scholar]
- Brown, J. C. 1971, Sol. Phys., 18, 489 [NASA ADS] [CrossRef] [Google Scholar]
- Cargill, P. J., Mariska, J. T., & Antiochos, S. K. 1995, ApJ, 439, 1034 [NASA ADS] [CrossRef] [Google Scholar]
- Chen, H., Yang, J., Duan, Y., et al. 2019a, ApJ, 879, 74 [NASA ADS] [CrossRef] [Google Scholar]
- Chen, X., Yan, Y., Tan, B., et al. 2019b, ApJ, 878, 78 [NASA ADS] [CrossRef] [Google Scholar]
- Demoulin, P., Henoux, J. C., Priest, E. R., & Mandrini, C. H. 1996, A&A, 308, 643 [NASA ADS] [Google Scholar]
- Doyle, L., Wyper, P. F., Scullion, E., et al. 2019, ApJ, 887, 246 [NASA ADS] [CrossRef] [Google Scholar]
- Emslie, A. G., Dennis, B. R., Shih, A. Y., et al. 2012, ApJ, 759, 71 [NASA ADS] [CrossRef] [Google Scholar]
- Fisher, G. H., Canfield, R. C., & McClymont, A. N. 1985, ApJ, 289, 414 [NASA ADS] [CrossRef] [Google Scholar]
- Fletcher, L., Dennis, B. R., Hudson, H. S., et al. 2011, Space Sci. Rev., 159, 19 [NASA ADS] [CrossRef] [Google Scholar]
- Fletcher, L., Hannah, I. G., Hudson, H. S., et al. 2013, ApJ, 771, 104 [NASA ADS] [CrossRef] [Google Scholar]
- Hernandez-Perez, A., Thalmann, J. K., Veronig, A. M., et al. 2017, ApJ, 847, 124 [NASA ADS] [CrossRef] [Google Scholar]
- Hong, J., Yang, J., Chen, H., et al. 2019, ApJ, 874, 146 [NASA ADS] [CrossRef] [Google Scholar]
- Hou, Y., Li, T., Yang, S., et al. 2019, ApJ, 871, 4 [NASA ADS] [CrossRef] [Google Scholar]
- Janvier, M., Aulanier, G., Pariat, E., & Démoulin, P. 2013, A&A, 555, A77 [NASA ADS] [CrossRef] [EDP Sciences] [Google Scholar]
- Janvier, M., Savcheva, A., Pariat, E., et al. 2016, A&A, 591, A141 [NASA ADS] [CrossRef] [EDP Sciences] [Google Scholar]
- Ji, H., Wang, H., Goode, P. R., Jiang, Y., & Yurchyshyn, V. 2004, ApJ, 607, L55 [NASA ADS] [CrossRef] [Google Scholar]
- Ji, H., Huang, G., Wang, H., et al. 2006, ApJ, 636, L173 [NASA ADS] [CrossRef] [Google Scholar]
- Jing, J., Xu, Y., Cao, W., et al. 2016, Sci. Rep., 6, 24319 [NASA ADS] [CrossRef] [Google Scholar]
- Krucker, S., Hudson, H. S., Jeffrey, N. L. S., et al. 2011, ApJ, 739, 96 [NASA ADS] [CrossRef] [Google Scholar]
- Lemen, J. R., Title, A. M., Akin, D. J., et al. 2012, Sol. Phys., 275, 17 [NASA ADS] [CrossRef] [Google Scholar]
- Li, H., & Yang, J. 2019, ApJ, 872, 87 [NASA ADS] [CrossRef] [Google Scholar]
- Li, T., & Zhang, J. 2015, ApJ, 804, L8 [NASA ADS] [CrossRef] [Google Scholar]
- Li, Y., Sun, X., Ding, M. D., Qiu, J., & Priest, E. R. 2017a, ApJ, 835, 190 [NASA ADS] [CrossRef] [Google Scholar]
- Li, H., Jiang, Y., Yang, J., et al. 2017b, ApJ, 836, 235 [NASA ADS] [CrossRef] [Google Scholar]
- Li, T., Yang, S., Zhang, Q., Hou, Y., & Zhang, J. 2018, ApJ, 859, 122 [NASA ADS] [CrossRef] [Google Scholar]
- Masson, S., Pariat, E., Aulanier, G., et al. 2009, ApJ, 700, 559 [NASA ADS] [CrossRef] [Google Scholar]
- Masson, S., Aulanier, G., Pariat, E., et al. 2012, Sol. Phys., 276, 199 [NASA ADS] [CrossRef] [Google Scholar]
- Priest, E. R., & Pontin, D. I. 2009, Physics of Plasmas, 16, 122101 [NASA ADS] [CrossRef] [Google Scholar]
- Qiu, J. 2009, ApJ, 692, 1110 [NASA ADS] [CrossRef] [Google Scholar]
- Qiu, J., Lee, J., Gary, D. E., & Wang, H. 2002, ApJ, 565, 1335 [NASA ADS] [CrossRef] [Google Scholar]
- Qiu, J., Wang, H., Cheng, C. Z., & Gary, D. E. 2004, ApJ, 604, 900 [NASA ADS] [CrossRef] [Google Scholar]
- Qiu, J., Longcope, D. W., Cassak, P. A., & Priest, E. R. 2017, ApJ, 838, 17 [NASA ADS] [CrossRef] [Google Scholar]
- Romano, P., Falco, M., Guglielmino, S. L., & Murabito, M. 2017, ApJ, 837, 173 [NASA ADS] [CrossRef] [Google Scholar]
- Savcheva, A., Pariat, E., McKillop, S., et al. 2016, ApJ, 817, 43 [NASA ADS] [CrossRef] [Google Scholar]
- Sharykin, I. N., & Kosovichev, A. G. 2014, ApJ, 788, L18 [NASA ADS] [CrossRef] [Google Scholar]
- Wang, H., & Liu, C. 2012, ApJ, 760, 101 [NASA ADS] [CrossRef] [Google Scholar]
- Wyper, P. F., Antiochos, S. K., & DeVore, C. R. 2017, Nature, 544, 452 [NASA ADS] [CrossRef] [Google Scholar]
- Wyper, P. F., DeVore, C. R., & Antiochos, S. K. 2018, ApJ, 852, 98 [NASA ADS] [CrossRef] [Google Scholar]
- Xu, Z., Yang, K., Guo, Y., et al. 2017, ApJ, 851, 30 [NASA ADS] [CrossRef] [Google Scholar]
- Yang, S., & Zhang, J. 2018, ApJ, 860, L25 [NASA ADS] [CrossRef] [Google Scholar]
- Yang, S., Zhang, J., & Xiang, Y. 2015, ApJ, 798, L11 [NASA ADS] [CrossRef] [Google Scholar]
- Zhang, Q. M., & Ni, L. 2019, ApJ, 870, 113 [NASA ADS] [CrossRef] [Google Scholar]
- Zhang, Q. M., Chen, P. F., Guo, Y., Fang, C., & Ding, M. D. 2012, ApJ, 746, 19 [NASA ADS] [CrossRef] [Google Scholar]
- Zhang, Q. M., Li, D., Ning, Z. J., et al. 2016a, ApJ, 827, 27 [NASA ADS] [CrossRef] [Google Scholar]
- Zhang, Q. M., Li, D., & Ning, Z. J. 2016b, ApJ, 832, 65 [NASA ADS] [CrossRef] [Google Scholar]
- Zhang, Q. M., Cheng, J. X., Feng, L., et al. 2019a, ApJ, 883, 124 [NASA ADS] [CrossRef] [Google Scholar]
- Zhang, Q. M., Li, D., & Huang, Y. 2019b, ApJ, 870, 109 [NASA ADS] [CrossRef] [Google Scholar]
- Zhao, J., Gilchrist, S. A., Aulanier, G., et al. 2016, ApJ, 823, 62 [NASA ADS] [CrossRef] [Google Scholar]
All Tables
Apparent speeds (km s−1) of the degradation of the western CR in different AIA wavelengths (Å).
All Figures
|
Fig. 1. Bottom panel: SXR light curves of the C5.5 flare in 0.5−4 Å (magenta line) and 1−8 Å (cyan line). Top panel: time derivative of the 1−8 Å flux. In each panel, the yellow region stands for the time of fast degradation of the outer CR. |
| In the text | |
|
Fig. 2. Eight snapshots of the AIA 304 Å images during 04:50−05:18 UT. The white arrows point to the CR, IR, two jets (jet1 and jet2), and three filaments (F1, F2, and F3). Two slices (S1 and S2) in panel c are used to investigate the propagation and rotation of jet1. The white dashed box in panel h shows the field of view of Fig. 3. The flare evolution is shown in a movie (anim304.mov) that is available online. |
| In the text | |
|
Fig. 3. Evolution of the flare ribbons observed in AIA 94 Å (a1–a6), 335 Å (b1–b6), 171 Å (c1–c6), and 1600 Å (d1–d6). The white arrows point to F1, F2, F3, and the PFL. The orange arrows point to the IR. The red and magenta arrows point to the eastern and western parts of the CR, respectively. The CR evolution is shown in a movie (animrb.mov) that is available online. |
| In the text | |
|
Fig. 4. Time-distance diagrams of S0 in various wavelengths, showing the fast degradation of the western CR during 04:58−05:10 UT. The apparent speeds are labeled. s = 0 and |
| In the text | |
|
Fig. 5. Time-distance diagrams of S1 and S2 in 304 Å. The apparent speeds are labeled. Panel a: s = 0 and s = 99″ on the y-axis denote the southern and northern endpoints of S1. Panel b: s = 0 and s = 48″ on the y-axis denote the eastern and western endpoints of S2. |
| In the text | |
Current usage metrics show cumulative count of Article Views (full-text article views including HTML views, PDF and ePub downloads, according to the available data) and Abstracts Views on Vision4Press platform.
Data correspond to usage on the plateform after 2015. The current usage metrics is available 48-96 hours after online publication and is updated daily on week days.
Initial download of the metrics may take a while.