Fig. 2.
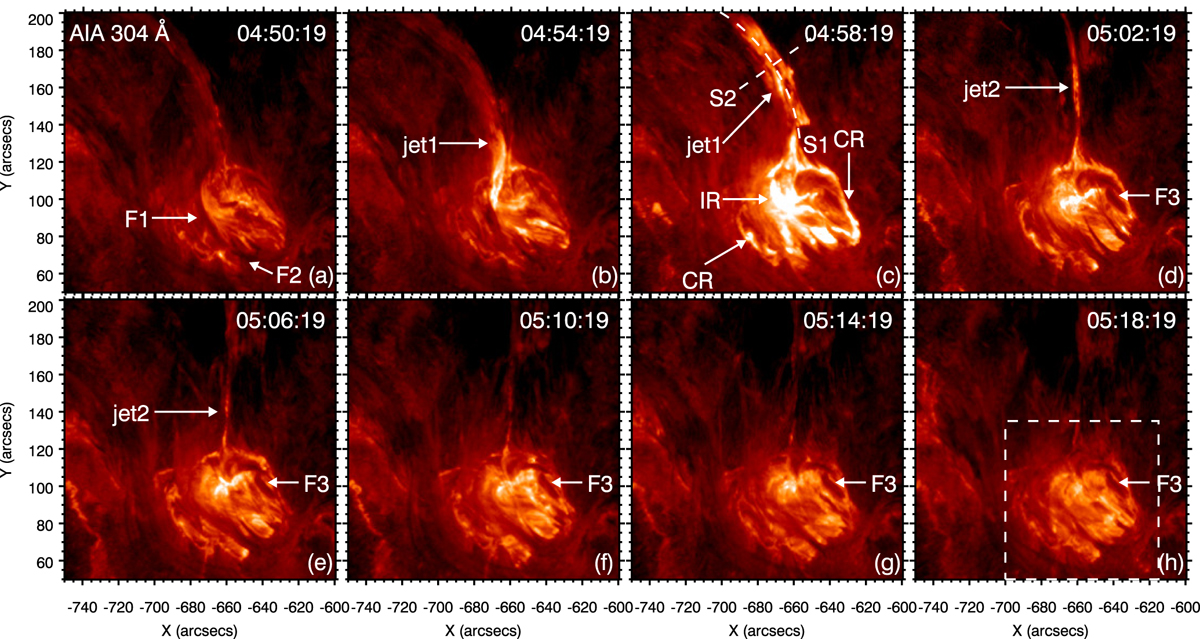
Eight snapshots of the AIA 304 Å images during 04:50−05:18 UT. The white arrows point to the CR, IR, two jets (jet1 and jet2), and three filaments (F1, F2, and F3). Two slices (S1 and S2) in panel c are used to investigate the propagation and rotation of jet1. The white dashed box in panel h shows the field of view of Fig. 3. The flare evolution is shown in a movie (anim304.mov) that is available online.
Current usage metrics show cumulative count of Article Views (full-text article views including HTML views, PDF and ePub downloads, according to the available data) and Abstracts Views on Vision4Press platform.
Data correspond to usage on the plateform after 2015. The current usage metrics is available 48-96 hours after online publication and is updated daily on week days.
Initial download of the metrics may take a while.