Free Access
Fig. 5.
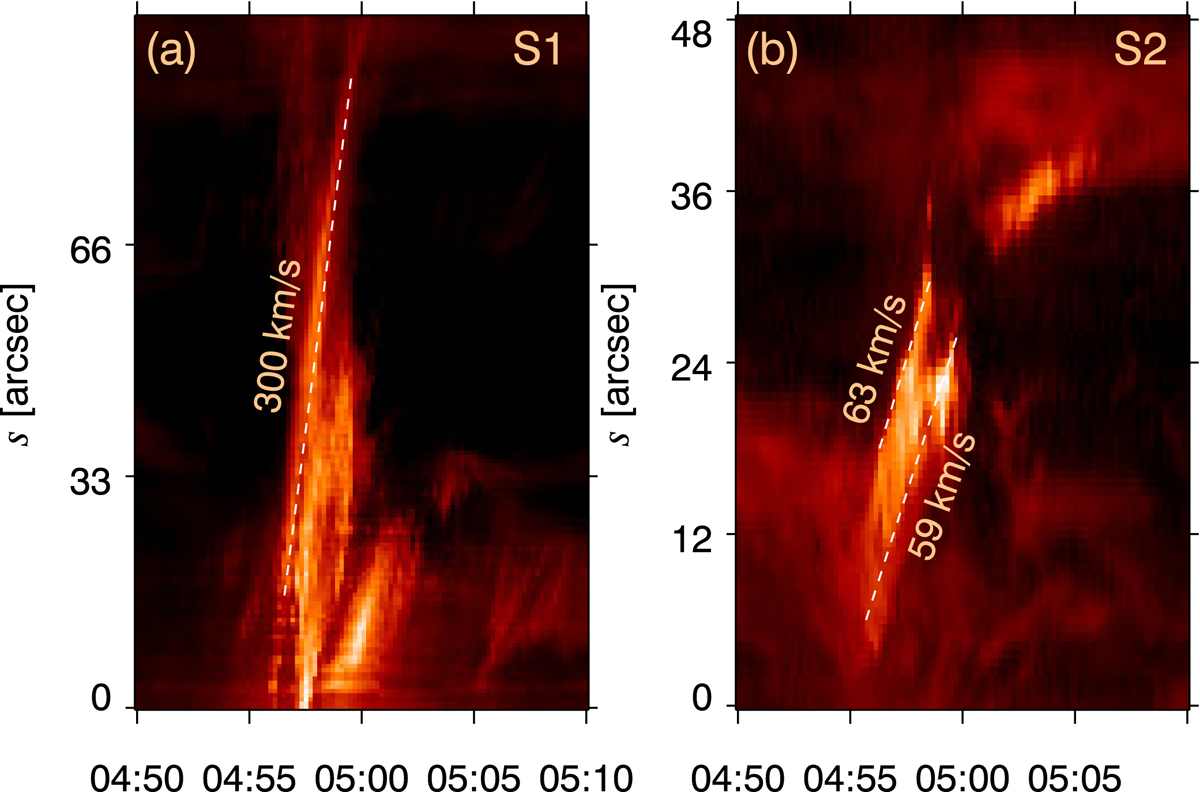
Time-distance diagrams of S1 and S2 in 304 Å. The apparent speeds are labeled. Panel a: s = 0 and s = 99″ on the y-axis denote the southern and northern endpoints of S1. Panel b: s = 0 and s = 48″ on the y-axis denote the eastern and western endpoints of S2.
Current usage metrics show cumulative count of Article Views (full-text article views including HTML views, PDF and ePub downloads, according to the available data) and Abstracts Views on Vision4Press platform.
Data correspond to usage on the plateform after 2015. The current usage metrics is available 48-96 hours after online publication and is updated daily on week days.
Initial download of the metrics may take a while.