Fig. 3.
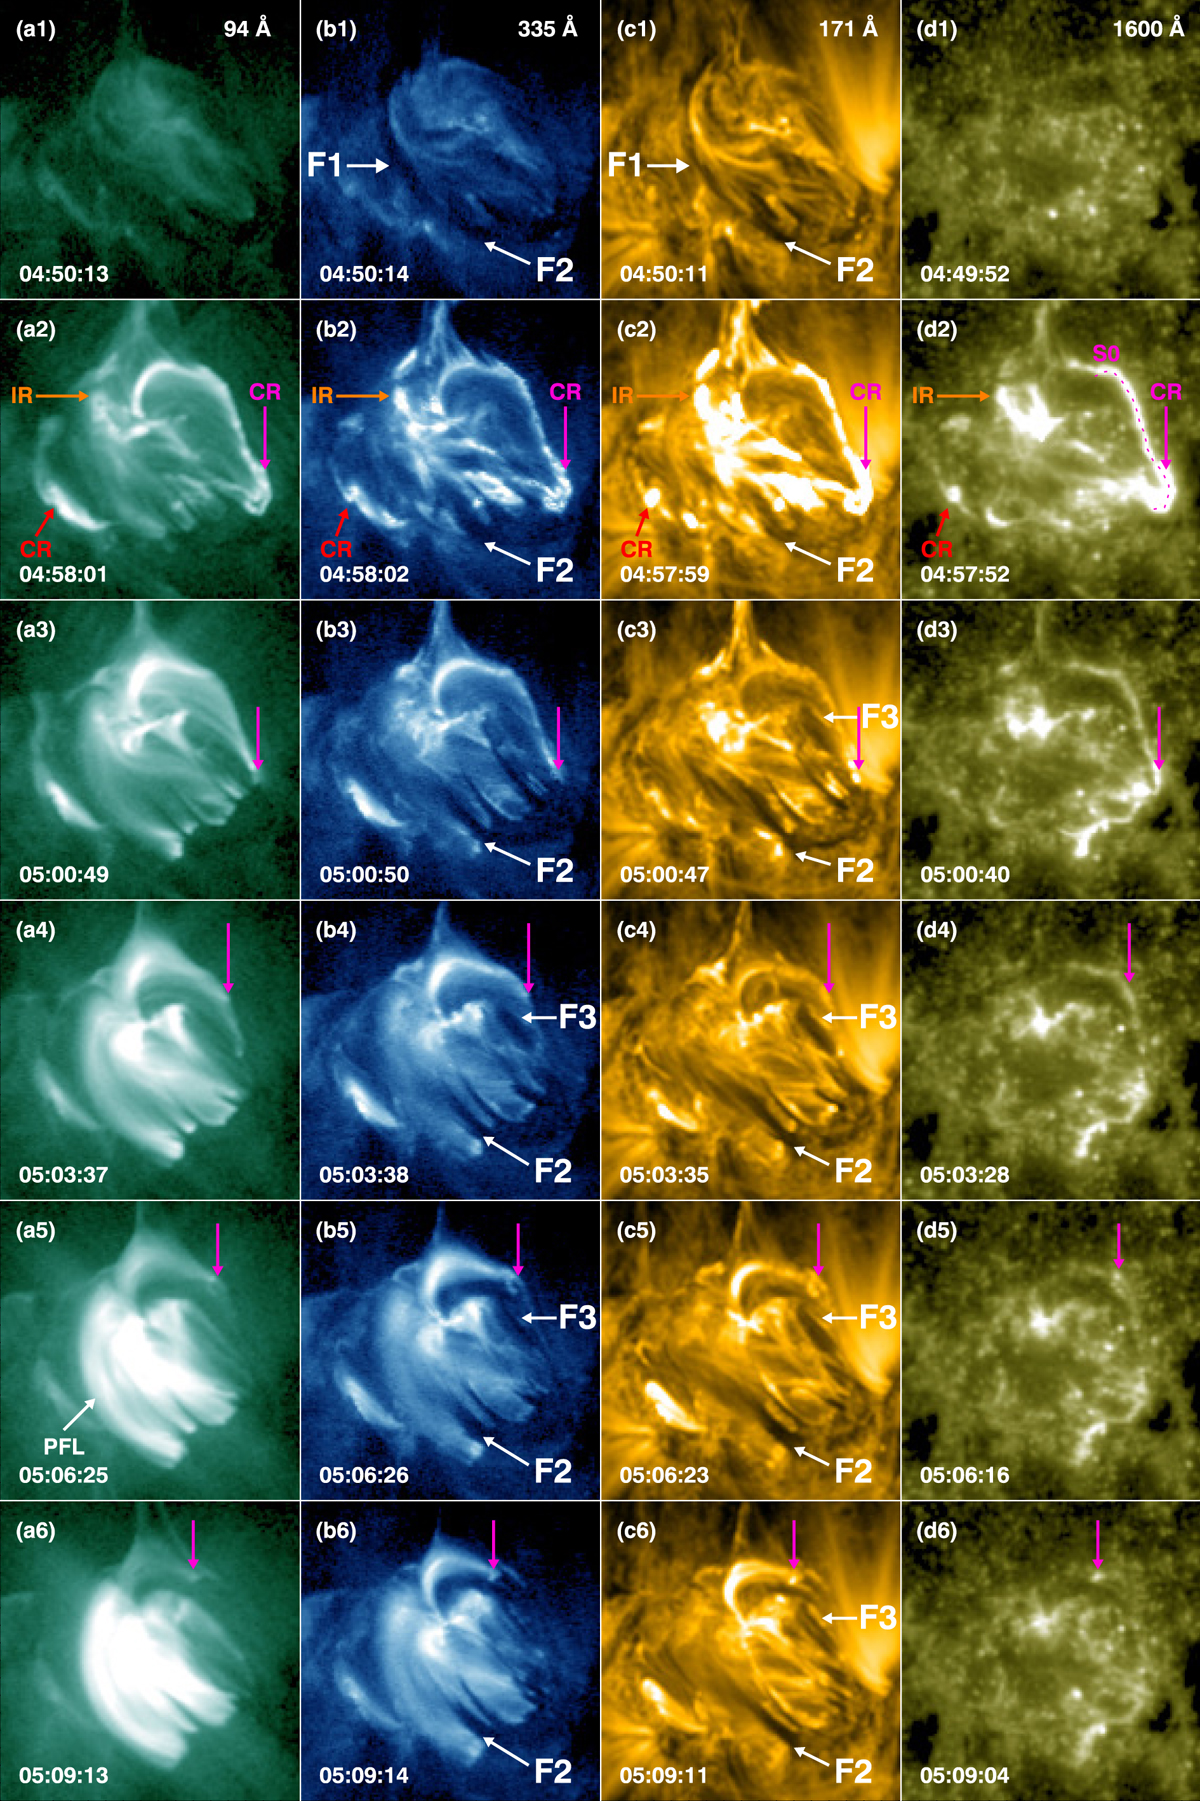
Evolution of the flare ribbons observed in AIA 94 Å (a1–a6), 335 Å (b1–b6), 171 Å (c1–c6), and 1600 Å (d1–d6). The white arrows point to F1, F2, F3, and the PFL. The orange arrows point to the IR. The red and magenta arrows point to the eastern and western parts of the CR, respectively. The CR evolution is shown in a movie (animrb.mov) that is available online.
Current usage metrics show cumulative count of Article Views (full-text article views including HTML views, PDF and ePub downloads, according to the available data) and Abstracts Views on Vision4Press platform.
Data correspond to usage on the plateform after 2015. The current usage metrics is available 48-96 hours after online publication and is updated daily on week days.
Initial download of the metrics may take a while.