| Issue |
A&A
Volume 636, April 2020
|
|
|---|---|---|
| Article Number | A64 | |
| Number of page(s) | 9 | |
| Section | Extragalactic astronomy | |
| DOI | https://doi.org/10.1051/0004-6361/202037793 | |
| Published online | 17 April 2020 | |
Absorbed relativistic jets in radio-quiet narrow-line Seyfert 1 galaxies
1
Finnish Centre for Astronomy with ESO (FINCA), University of Turku, Vesilinnantie 5, 20014 Turku, Finland
e-mail: This email address is being protected from spambots. You need JavaScript enabled to view it.
2
Aalto University Metsähovi Radio Observatory, Metsähovintie 114, 02540 Kylmälä, Finland
3
European Space Agency, European Space Astronomy Centre, C/ Bajo el Castillo s/n, 28692 Villanueva de la Cañada, Madrid, Spain
e-mail: This email address is being protected from spambots. You need JavaScript enabled to view it.
4
Dipartimento di Fisica e Astronomia “G. Galilei”, Università di Padova, Vicolo dell’Osservatorio 3, 35122 Padova, Italy
5
Aalto University Department of Electronics and Nanoengineering, PO Box 15500, 00076 Aalto, Finland
6
Las Campanas Observatory, Carnegie Institution of Washington, Colina El Pino, Casilla 601, La Serena, Chile
7
National Centre for Radio Astrophysics – Tata Institute of Fundamental Research, Post Bag 3, Ganeshkhind, Pune 411007, India
8
Center for Interdisciplinary Exploration and Research in Astrophysics CIERA, Department of Physics and Astronomy, Northwestern University, Evanston, IL 60208, USA
Received:
21
February
2020
Accepted:
5
March
2020
Abstract
Narrow-line Seyfert 1 (NLS1) galaxies are peculiar active galactic nuclei. Most of them do not show strong radio emission, but seven radio-quiet (or radio-silent) NLS1s have recently been detected flaring multiple times at 37 GHz by the Metsähovi Radio Telescope, indicating relativistic jets in these peculiar sources. We observed them with the Karl G. Jansky Very Large Array (JVLA) in A configuration at 1.6, 5.2, and 9.0 GHz. Our results show that these sources are either extremely faint or not detected in the JVLA bands. At these frequencies, the radio emission from their relativistic jet must be absorbed, either through synchrotron self-absorption as it occurs in gigahertz-peaked sources, or more likely, through free-free absorption by a screen of ionized gas associated with starburst activity or shocks. Our findings cast new shadows on the radio-loudness criterion, which seems to be increasingly frequently a misleading parameter. New high-frequency and high-resolution radio observations are essential to test our hypotheses.
Key words: galaxies: active / galaxies: jets / galaxies: Seyfert / radio continuum: galaxies
© ESO 2020
1. Introduction
In approximately 10% of active galactic nuclei (AGN) the system of a black hole and an accretion disk is capable of launching powerful relativistic plasma jets, which in some cases have enough energy to propagate outside the host galaxy. Traditionally, the signature of relativistic jets is strong radio emission that is due to synchrotron radiation. Conversely, the relativistic jet is typically less dominant in the optical band. For these reasons, the radio-loudness criterion introduced by Kellermann et al. (1989), defined as the ratio between the flux density at 5 GHz and the optical B-band flux density, is usually good at separating sources with and without relativistic jets. When the ratio is higher than 10, the source is classified as radio-loud. If the ratio is lower than 10, the source is radio-quiet. The power and luminosity of relativistic jets depend on the black hole mass and follow a nonlinear scaling relation. This means that low-mass AGN inevitably harbor less powerful jets (Heinz & Sunyaev 2003; Foschini 2014). Because the scaling weighs the radio luminosity higher than in the optical, the radio-loudness criterion can become inadequate in low-mass sources.
Narrow-line Seyfert 1 (NLS1) galaxies are a well-known example of low-mass AGN (Peterson 2011). Classified for the first time by Osterbrock & Pogge (1985), they are characterized by a low full width at half-maximum (FWHM) of the Hβ line, which is usually interpreted as a low rotational velocity around a low-mass (106–108M⊙) black hole (e.g., Rakshit et al. 2017; Chen et al. 2018; Peterson & Dalla Bontà 2018). NLS1s belong to the so-called population A of the AGN main sequence (MS, Sulentic et al. 2002; Sulentic & Marziani 2015; Marziani et al. 2018). AGN indeed seem to live in a specific locus of the plane defined by the R4570 parameter, that is, the relative intensity of Fe II multiplets with respect to Hβ, and by the FWHM(Hβ), also known as eigenvector 1 (Boroson & Green 1992). The physical driver of the MS may be a combination of inclination and Eddington ratio (Panda et al. 2019). The latter is very high in population A sources like NLS1s (low FWHM and high R4570), and along with the low black hole mass and several other physical properties, this characteristic may indicate that NLS1s and possibly population A sources in general may be one of the early phases of AGN life (Mathur 2000; Sulentic et al. 2000; Fraix-Burnet et al. 2017; Berton et al. 2017, 2020).
A small fraction (∼7%, Komossa et al. 2006) of NLS1s can be classified as radio-loud and likely harbors relativistic jets. Their jet power is lower than that of flat-spectrum radio quasars (FSRQs), but comparable to those of BL Lacertae objects (BL Lacs, Foschini et al. 2015). In BL Lacs, the low jet power can be attributed to an inefficient accretion mechanism (Heckman & Best 2014; Foschini 2017). In FSRQs and NLS1s the accretion mechanism is instead the same, and their jet power, as expected, follows the nonlinear scaling with the black hole mass (Foschini 2017).
The vast majority of the NLS1 population is either radio-quiet or never detected at any radio frequency (radio-silent). That the low radio luminosity is lower than the optical luminosity may be due to the absence of relativistic jets. However, most radio-loud NLS1s are found in the high-mass part of the NLS1 distribution, while radio-quiet and radio-silent objects have lower black hole masses (Foschini et al. 2015; Berton et al. 2015; Cracco et al. 2016, albeit this could be a selection effect, see Järvelä et al. 2017). If these low-mass objects had relativistic jets, they would have a rather low radio luminosity because the jet power is low, which would lead a classification as radio-quiet. Furthermore, even relatively powerful relativistic jets, when misaligned, might be faint at radio frequencies because we would not see any relativistic beaming effects (Berton et al. 2018a). This means that sources with relativistic jets might be hidden among the radio-quiet or radio-silent population (Foschini 2011, 2012; Berton et al. 2015).
The detection of radio-quiet and radio-silent NLS1s at 37 GHz with the Metsähovi Radio Telescope (Finland) at flux densities close to 1 Jy, although unexpected, might be understood in this scenario (Lähteenmäki et al. 2017, 2018). Although they were previously undetected in radio, some NLS1s harbor relativistic jets that can be seen even at high frequencies during flares. However, considering the nature of NLS1s, it is also possible that their relativistic jets are extremely young. Such sources have been observed in radio only by the Faint Images of the Radio Sky at Twenty-cm (FIRST) and NRAO VLA Sky Survey (NVSS; Becker et al. 1995; Condon et al. 1998). Their jets may have been launched at some point between the old observations and the Metsähovi survey. Finally, one last possibility is that their radio spectra are extremely inverted (α ≲ −2, Sν ∝ ν−α) as a result of some form of absorption. Both free-free and synchrotron self-absorption might indeed absorb the radiation of the relativistic jet at low frequencies while leaving high-frequency photons free to escape.
To distinguish between these diverse options, we observed seven of these sources with the Karl G. Jansky Very Large Array (JVLA). All of them have been detected multiple times at 37 GHz with the Metsähovi Radio Telescope. In Sect. 2 we describe the observations and the data analysis, in Sect. 3 we present our results, in Sect. 4 we discuss them, and in Sect. 5 we provide a brief summary of our work. Throughout this paper, we adopt a standard ΛCDM cosmology, with a Hubble constant H0 = 70 km s−1 Mpc−1, and ΩΛ = 0.73 (Komatsu et al. 2011).
2. Data reduction and analysis
The sources were part of a sample of 66 objects selected according to their large-scale environment (Järvelä et al. 2017) and promising multiwavelength properties (Järvelä et al. 2015; Lähteenmäki et al. 2018). The host galaxy morphology has been studied for only a handful of them, but it is preferentially a spiral with ongoing interaction (Järvelä et al. 2018, and in prep.), a characteristic that seems common among jetted NLS1s (Antón et al. 2008; Kotilainen et al. 2016; Olguín-Iglesias et al. 2017, 2020; Berton et al. 2019). Out of these 66, 7 have been detected more than once at 37 GHz at Metsähovi. The basic properties of these sources are shown in Table 1. We observed these 7 objects with the JVLA in A configuration in three different bands, L, C, and X, centered at 1.6 GHz, 5.2 GHz, and 9.0 GHz, and divided into 16 spectral windows. The total bandwidth was 1 GHz at 1.6 GHz, and 2 GHz at 5.2 GHz and 9.0 GHz. For each source we observed the NLS1 3C 286 (Berton et al. 2017) as main calibrator, and nearby bright unresolved sources for phase calibration. The project code is 19A-200 (P.I. Berton). The expected noise levels were 20, 8, and 9 μJy at 1.6 GHz, 5.2 GHz, and 9.0 GHz, respectively.
Radio-quiet or radio-silent NLS1s detected at 37 GHz.
We reduced and analyzed the data using the Common Astronomy Software Applications (CASA) version 5.0.0-218 and the standard JVLA data reduction pipeline version 5.0.0. To produce the maps we used a pixel size of 0.15″ at 1.6 GHz, 0.05″ at 5.2 GHz, and 0.025″ at 9.0 GHz. At all frequencies, we first examined a squared region of 2048 px centered on the source, which is large enough to cover the entire primary beam. If sidelobes of other nearby sources were clearly visible, we increased the size of the map in order to model also these neighboring sources. Otherwise, we just modeled the source using the CLEAN algorithm. In all cases but one, we reached a noise close to the theoretical level. We did not perform self-calibration on the data.
When a source was detected we modeled it using a single Gaussian in the image plane to produce maps, and we deconvolved the beam from the core, that is, we derived the core’s deconvolved size, its position angle (PA), the peak, and integrated flux density. When the source was not point-like, we measured the integrated flux density in the region within the 3σ contour, where σ is the noise of the image. We then calculated the luminosity accounting for K-correction by following
 (1)
(1)
where Sν is the flux density at frequency ν, and dl is the luminosity distance corresponding to redshift z, and for αν we used the spectral indexes calculated from our data and shown in Table 3. The spectral indexes between 1.6 GHz and 5.2 GHz and between 5.2 GHz and 9.0 GHz were estimated following the usual relation
 (2)
(2)
Finally, we estimated the brightness temperature of the sources as done by Doi et al. (2013),
![Mathematical equation: $$ \begin{aligned} T_{\rm b} = 1.8\times 10^9 (1 + z) \frac{S_{\rm \nu ,p}}{\nu ^2 \theta _{\rm maj} \theta _{\rm min}} [\mathrm{K}], \end{aligned} $$](/articles/aa/full_html/2020/04/aa37793-20/aa37793-20-eq9.gif) (3)
(3)
where Sν, p is the peak flux density expressed in mJy beam−1, ν is the frequency in GHz, and θmaj, θmin are the major and minor axis of the source core in milliarcseconds, deconvolved from beam. It is worth noting that the brightness temperature is commonly estimated from high-resolution measurements, therefore our estimates are only lower limits. However, they are directly comparable with those already derived for different classes of NLS1s by Berton et al. (2018a), whose observations were also carried out with the JVLA in A configuration. For this reason, we limited our brightness temperature estimate at 5.2 GHz, where the sources in Berton et al. (2018a) were studied. The radio maps of the detected sources are shown in Figs. 1–5. Flux densities and luminosities are reported in Table 2, and other physical parameters we measured from the maps are shown in Table 3.
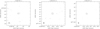 |
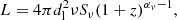
Fig. 1. From left to right: maps of J1228+5017 at 1.6 (L), 5.2 (C), and 9.0 GHz (X), respectively. The rms of the maps is 23, 8, and 7 μJy, respectively, the contour levels are at rms × (−3, 3 × 2n), n ∈ [0,3], and beam size 2.77 × 2.32 kpc at 5.2 GHz. |
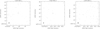 |
Fig. 2. From left to right: maps of J1232+4957 at 1.6 (L), 5.2 (C), and 9.0 GHz (X), respectively. The rms of the maps is 21, 7, and 7 μJy, respectively, the contour levels are at rms × (−3, 3 × 2n), n ∈ [0,1], and beam size 2.76 × 2.25 kpc at 5.2 GHz. |
Flux densities and luminosities in all bands.
Geometrical and physical properties of the sources.
3. Results
Out of the seven sources we observed, four were detected in all three bands with the JVLA. One of them, J1232+4957, was detected only at 1.6 GHz and 5.2 GHz. The remaining two, J1029+5556 and J1509+6137, were not detected in any band.
Two of the sources, J1522+3934 and J1641+3454, have previously been observed in the FIRST survey at 1.6 GHz in B configuration, which measured flux densities of 1.88 ± 0.14 and 2.43 ± 0.13 mJy, respectively. The integrated flux density we measured at 1.6 GHz was 2.03 ± 0.16 and 2.52 ± 0.10 mJy, respectively. These results agree well with those from the FIRST. The other sources are all still below the detection threshold of the FIRST. In conclusion, we do not find any significant luminosity increase in the last about 25 years for any of our sources at 1.6 GHz.
Our observations at 5.2 GHz and 9.0 GHz are the first that were performed for these objects. The observed spectra of all the sources is shown in Fig. 6. The spectral indexes we measured clearly indicate that the spectrum remains steep in the whole spectral region covered by our JVLA data. After this, the spectra seem to change slope at some point above 10 GHz and start to rise to reach the flux densities measured at 37 GHz. Between 1.6 GHz and 5.2 GHz, the median spectral index of the peak flux is 0.86, and between 5.2 GHz and 9.0 GHz the median is 0.71. This shows that the slope tends to already become flatter below 10 GHz. This behavior is observed in three out of five sources with known spectral index. Only in J1641+3454 do the spectral indexes remain the same, while J1232+4957 is not detected at 9.0 GHz and the spectral index is only an upper limit. The behavior remains the same for the integrated emission. The median spectral index of the total emission is 1.31 between 1.6 GHz and 5.2 GHz, and 0.82 between 5.2 GHz and 9.0 GHz. As before, J1614+3454 has a constant spectral index, and J1232+4957 becomes steeper. When our results are compared to the in-band spectral indexes measured in at 5.2 GHz by Berton et al. (2018a), they are either comparable either to those of typical radio-quiet and putatively non-jetted NLS1s, or to those of jetted steep-spectrum radio-loud NLS1s (i.e. misaligned objects, see Berton et al. 2016a). However, only J1641+3454 can formally be classified as radio-loud, while all the other objects in our sample are radio-quiet (Lähteenmäki et al. 2018). We did not calculate the spectral index of our sources between 9.0 GHz and 37 GHz because the data are not simultaneous, and the 37 GHz flux is likely measured during flares. It is worth noting that above 10 GHz, the spectra are somewhat similar to those observed in a handful of γ-ray emitting NLS1s, such as 1H 0323+342 and FBQS J1644+2619 (Lähteenmäki et al. 2017). In analogy to what is seen here, the spectrum tends to rise at higher frequencies in these cases as well, although with significantly less extreme spectral indexes.
As mentioned above, we estimated the brightness temperature of our sources using only data at 5.2 GHz. The median value is approximately ∼100 K, while the highest temperature limit (831 K) is found in J1641+3454, which as mentioned above is the only object of our sample that is both radio-loud and detected in γ rays. Nevertheless, when compared to the samples by Berton et al. (2018a), the brightness temperature limit of J1641+3454 is lower than that of any beamed object, but it is within the range of both radio-quiet and steep-spectrum radio-loud sources. Of the remaining four sources with a measured brightness temperature, two lie below the threshold of 100 K, where only radio-quiet sources are found, and the other two are also found in the region where both radio-quiet and steep-spectrum radio-loud objects are, although they have a lower temperature than J1641+3454.
Finally, in terms of luminosity, Berton et al. (2018a) found no jetted source with integrated luminosity below 1.5 × 1039 erg s−1 at 5.2 GHz. The brightest of our sources is J1228+5017, whose luminosity at 5.2 GHz of 1.0 × 1039 erg s−1 is already below that threshold. All the other objects have even lower luminosities, including the sources for which we were able to estimate only upper limits. Therefore all the NLS1s in our sample seem to be more related to typical radio-quiet sources than to steep-spectrum radio-loud objects.
4. Discussion
4.1. Convex radio spectrum in NLS1s
Considering the results of our JVLA observations, the detection of radio-quiet or radio-silent NLS1s at 37 GHz becomes even more puzzling. If the spectra were continue to decrease with the spectral index we measured between 5.2 and 9.0 GHz, the expected flux density at 37 GHz would be 82 μJy in the best-case scenario (that of J1641+3454). Instead, we observe a flux density that is about 4500 times higher than this. Even for the flare of a jetted AGN, an increase in luminosity like this would be fairly extreme, and it also be reflected at other wavelengths, such as in optical. However, none of our sources have been detected in a flaring state at optical wavelengths by any survey aimed at finding transient objects. It is therefore not far-fetched to assume that the spectrum does not decrease linearly, but it is instead convex. The position of the minimum cannot be determined from our data. However, we can hypothesize that it is located at some point between 9.0 and 37 GHz. The spectral indexes between these bands, using the data measured at 37 GHz, are between α9−37 GHz = −5.32 for J1641+3454 and α9−37 GHz = −6.8 in the case of J1510+5547. These values are not measured with simultaneous observations, therefore they are almost certainly lower limits. It is likely that the 37 GHz observations were carried out during a flaring state of the source. The detection of these sources at 37 GHz clearly indicates that the high-frequency radio emission of these NLS1s is highly variable. The fluxes measured in different epochs at 37 GHz are not consistent with each other (Lähteenmäki et al. 2018), and the most likely explanation for such a strong variability (J1522+3934 went from 0.3 Jy to 1.4 Jy within a few weeks) is a relativistic jet (although an alternative option is explored below, see Sect. 4.3).
An inverted spectrum from a relativistic jet may originate in synchrotron self-absorption. When we assume its typical spectral index, α = −2.5, and extrapolate from the flux density measured at 37 GHz, the expected Sν at 9.0 GHz during the flare would be around 13 mJy. This value corresponds to a flux density increase of about 400 times, which under typical conditions, should also be seen by optical transient surveys (e.g., Bellm et al. 2019), assuming that the flare occurs throughout the whole electromagnetic spectrum. The spectrum between 9 and 37 GHz may therefore have a higher slope than that of synchrotron self-absorption, and the high-frequency excess is not (entirely) due to a flaring state of the source.
4.2. Star formation at low frequencies
If a relativistic jet is present, it should be visible also at low frequencies. However, JVLA observations do not seem to confirm the presence of this feature. The radio spectrum of most of our sources can be perfectly explained without any need for a jet component. In terms of spectral index, brightness temperature, and especially luminosity, all of them seem to be dominated by star formation. The latter is a combination of free-free emission, which has an almost flat radio spectrum, and steep synchrotron emission from supernova remnants. When combined, these lead to an observed spectral index of ∼0.7, which is characteristic of star-forming galaxies, and roughly in agreement with the spectral indexes of our sources (e.g., Condon 1992; Panessa et al. 2019).
However, at least in the γ-ray source J1641+3454, a relativistic jet must be present. The detection of γ rays is associated with a beamed relativistic jet, which typically has a flat radio spectrum in the JVLA range. However, its low-frequency spectrum is clearly steep, its brightness temperature is rather low (but still consistent with a misaligned jet), and its radio luminosity is very low, the lowest ever measured for a γ-ray NLS1 (e.g., Berton et al. 2018a; Paliya 2019). Even in this object the radio emission in this spectral region therefore appears not to be dominated by the relativistic jet, but by star formation activity.
In population A sources of the quasar MS, especially those with prominent Fe II features, star formation is typically very strong (Sani et al. 2010; Marziani et al. 2018). In some cases, its contribution to the radio emission can be so high that the source is classified as radio-loud even if no relativistic jet is present (Ganci et al. 2019). Objects like this may be common among NLS1s. The infrared colors of some flat-spectrum radio-loud sources seem to suggest that the bulk of their radio emission originates from star-forming regions (Caccianiga et al. 2015). It would therefore not be surprising to find out that even the radio emission of a (barely) radio-loud source such as J1641+3454 is due to star formation. It is also worth noting that the 1.6 GHz map of J1522+3934 of Fig. 4 (left) has a nice counterpart in the infrared morphology of the source (Järvelä et al. 2018). This source is hosted by a spiral galaxy that interacts with a close companion, and the diffuse radio emission is well aligned with the two nuclei, possibly because it originates in a starburst induced by the ongoing interaction.
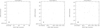 |
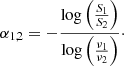
Fig. 3. From left to right: maps of J1510+5547 at 1.6 (L), 5.2 (C), and 9.0 GHz (X), respectively. The rms of the maps is 21, 8, and 7 μJy, respectively, the contour levels are at rms × (−3, 3), and beam size 1.45 × 1.29 kpc at 5.2 GHz. |
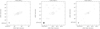 |
Fig. 4. From left to right: maps of J1522+3934 at 1.6 (L), 5.2 (C), and 9.0 GHz (X), respectively. The rms of the maps is 21, 12, and 7 μJy, respectively, the contour levels are at rms × (−3, 3 × 2n), n ∈ [0,4], and beam size 0.73 × 0.66 kpc at 5.2 GHz. |
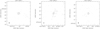 |
Fig. 5. From left to right: maps of J1641+3454 :joy:. The rms of the maps is 27, 8, and 7 μJy, respectively, the contour levels are at rms × (−3, 3 × 2n), n ∈ [0,4], and beam size 1.48 × 1.44 kpc at 5.2 GHz. |
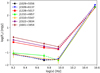 |
Fig. 6. Radio spectra of our sample. The three points below 10 GHz are those measured by the JVLA, while the last point is the average value detected at 37 GHz. The last point was not observed simultaneously with the others. The solid lines represent the spectrum, and the dashed lines connect either upper or lower limits of flux densities and therefore represent limits on the spectral index. |
However, we need to consider whether star formation might account for the γ-ray emission of J1641+3454, and if the prominent variability observed at high frequency at 37 GHz might be explained if only star formation were present. We estimated the radio flux densities produced by star formation processes by using the known relation between the radio and infrared emission. We used the equations given in Boyle et al. (2007) for the 1.5 GHz−24 μm relation. Instead of 24 μm data, we used the Wide-field Infrared Survey Explorer (WISE) W4 data, which have a wavelength of 22 μm, and our radio observations are at 1.6 GHz, but these small differences are not expected to affect the relation significantly. The radio flux densities estimated from the WISE W4 flux densities agree well with the values observed at 1.6 GHz, except for two sources, J1522+3934 and J1641+3454. The radio flux density of J1522+3934 is almost an order of magnitude higher than predicted by the W4 flux density, and additionally, its W4 flux density value has a variability flag, suggesting that the jet contribution might not be insignificant at 22 μm. However, despite the possible contribution of the jet, its radio flux density is higher than expected, indicating that star formation is not a sufficient explanation for the whole radio emission. J1641+3454 is not so very extreme because the observed radio emission is about twice higher than the predicted emission. The jet might contribute at 1.6 GHz and increase increasing toward higher frequencies, as indicated by the slightly flattening spectral indexes between 5.2 and 9.0 GHz when compared to the index between 1.6 and 5.2 GHz.
4.3. Coronal emission scenario
An inverted slope toward high frequency in the radio spectrum of AGN is not entirely new. Some observations of radio-quiet quasars in the 1980s have found that some sources an excess at high frequencies is present, particularly in type 1 AGN (Edelson 1987; Antonucci & Barvainis 1988; Barvainis & Antonucci 1989). Similar high-frequency excesses have often been found in the literature among radio-quiet quasars (Planck Collaboration I 2011; Behar et al. 2015; Doi & Inoue 2016), although the behavior of none of them is as extremely variable as that of our sources.
An interesting possibility is instead that the radio emission originates from the AGN corona, which as seen from X-rays is rather prominent in NLS1s (Gallo 2018). Because the corona is very compact, Laor & Behar (2008) suggested that its emission might be synchrotron self-absorbed in the low-frequency range where star formation emission dominates instead, and it may therefore appear as a sudden change of slope in the spectrum, with a peak around some hundreds of gigahertz. In particular, this emission would be strongly variable as a result of its nature, and would correlate with the X-ray emission.
Recently, we found that shortly after a new radio detection of J1641+3454 at 37 GHz the source showed a brightening in the X-rays with respect to the luminosity that was measured in the low state. A detailed analysis of the properties of J1641+3454 in X-rays will be the subject of an upcoming paper. However, this result already confirms that the radio emission detected at 37 GHz comes from J1641+3454. This behavior might be consistent with what is expected if the corona is responsible for the radio emission. However, it is not different from what is observed during regular blazar flares, in which both the radio and the X-rays originate in a relativistic jet (e.g., Berton et al. 2018b). This observation therefore does not prove the coronal origin of the high-frequency emission. Furthermore, the luminosity we measure at 37 GHz is at least one order of magnitude higher than any previous measurement from radio-quiet quasars.
To test this hypothesis, we verified the position of our sources on the Güdel−Benz (GB) relation for radio-quiet quasars (Guedel & Benz 1993), which links the X-ray emission to the radio emission. In principle, we would expect a roughly constant ratio between the radio and the X-ray luminosities, with LR ∼ 10−5LX. We derived the X-ray luminosity for five out of seven sources from the ROSAT archive (Boller et al. 2016). Two sources, J1029+5556 and J1522+3934, have no X-ray detections. Interestingly, when we tested them against the luminosities at 1.6 GHz, our sources lie close to the relation. However, when the X-ray luminosity is compared to the 37 GHz luminosity, all of our sources deviate significantly from the GB relation, with ratios between 0.1 and 1. This appears to indicate that the 37 GHz emissions do not share the same origin, and that therefore the corona is likely not responsible for the high-frequency excess. In conclusion, even though it is appealing, the coronal origin of this radio emission may not be the correct explanation for this phenomenon.
4.4. Extremely young GPS and synchrotron self-absorption
The classes of radio sources known as gigahertz-peaked sources (GPS) and high-frequency peakers (HFP) are kinematically young AGN observed at large angles. It is widely believed that with time they first grow into the other class of young sources known as compact steep-spectrum (CSS) sources, and then into fully developed radio galaxies (Fanti et al. 1995; O’Dea 1998). Young radio sources are characterized by a spectral turnover that peaks around 1 GHz for GPS, at higher frequencies for HFP, or at lower frequencies for CSS sources. The rising part of the spectrum is likely due to synchrotron self-absorption (although free-free absorption may also play a role), while above the turnover, the gas is optically thin and the synchrotron slope reflects the energy distribution of the electrons. The turnover frequency decreases when the projected linear size of the radio source increases, that is, large sources peak at lower frequencies than small sources. This behavior is typically explained in terms of the kinematic age of the radio source. Older sources are larger than the young ones, their relativistic jets expand, their energy density decreases, and their spectra peak at increasingly lower frequencies. Extremely young objects would therefore peak at very high frequencies, as observed in HFP.
It is widely accepted that NLS1s, both jetted and non-jetted, are also AGN in an early phase of their evolution (Mathur 2000; Komossa 2018; Paliya 2019). For this reason, some authors suggested that a link between NLS1s and CSS or GPS sources might exist (e.g. Oshlack et al. 2001; Gallo 2006; Komossa et al. 2006; Yuan et al. 2008; Caccianiga et al. 2014, 2017; Schulz et al. 2016; Gu et al. 2015; Liao & Gu 2020), and even that CSS or GPS could constitute part of the parent population of jetted NLS1s (Berton et al. 2017; Foschini 2017). If this is the case, some NLS1s may have only recently developed relativistic jets, which would be still confined to within a few parsec from the central engine. Using the relation by O’Dea & Baum (1997),
 (4)
(4)
where νto is the turnoff frequency in GHz and LS is the linear size in kiloparsec, a source peaked at 37 GHz would correspond to a linear size of ∼1.8 pc. When we assume that the relativistic jet propagates at the speed of light, this would in turn correspond to a kinematic age of the relativistic jet of 6 years. With a more realistic propagation velocity of about 0.3c, the age would be approximately 20 years, which would be young but not unprecedentedly so (Giroletti & Polatidis 2009). It is also worth noting that a dense circumnuclear medium might also hamper the propagation of relativistic jets through its interaction with the clouds (van Breugel et al. 1984). This effect would be enhanced in presence of a nonflattened broad-line region (BLR) where clouds are still located above and below the accretion disk plane. This geometry might be realistic in the case of NLS1s (Kollatschny & Zetzl 2011, 2013; Vietri et al. 2018; Berton et al. 2020).
In this young-age scenario, the radio spectrum has multiple components. The low-frequency emission may be dominated by the strong star formation that is typical of NLS1s, while at higher frequencies, the spectrum may rise again as a result of the misaligned relativistic jet component. Although in general, the emission from a relativistic jet would always dominate that from star formation at radio frequencies, this may not be the case in NLS1s because their star formation rate is higher than in other AGN and can contribute significantly to the radio emission (Sani et al. 2010; Caccianiga et al. 2015).
We remark that the first detection at 37 GHz occurred in 2015 (Lähteenmäki et al. 2018). Assuming that the original peak was at 37 GHz and that the jet propagates between 0.3c and c, the turnoff of the radio spectrum would have already moved by between about 32 to 25 GHz in five years. This means that the convex feature should move toward lower energies, the detection rate at 37 GHz should decrease because the low-state flux density would decrease, and we should already see the spectrum rise at 9.0 GHz. New observations are therefore essential to test this scenario.
4.5. Ionized gas and free-free absorption
As previously mentioned, the low-frequency (up to 10 GHz) emission in our sources is consistent with being produced by star formation processes, while the high-frequency emission may be dominated by the relativistic jet. Another possible scenario might account for their unusual behavior. Because we do not see a dominant jet component at JVLA frequencies, some kind of absorption must be active in the low-frequency regime. When we exclude synchrotron self-absorption, the other possible candidate may instead be free-free absorption. In the most extreme cases, its spectral index may reach a value of α = −4 (e.g., Condon 1992; Falcke et al. 1999; Tingay & de Kool 2003). In this case, assuming that the minimum of the spectrum is located at 10 GHz and that this frequency represents the flux density observed in the low state of the jet, we obtained in the representative case of J1641+3454 a low-state flux density at 37 GHz of ∼103 mJy. This value is still below the detection threshold of Metsähovi, as expected, and it requires that during flares, the source increases its flux density by a factor of ∼4, which may be a rather common event. Furthermore, flares are usually associated with the ejection of new components in the relativistic jets that propagate downstream. These components usually have a higher Doppler factor than the typical bulk motion in the jet (3 − αe with respect to 2 − αe, where αe is the spectral index of the electron population), at high frequencies, their brightness may therefore be strongly enhanced by relativistic effects.
In conclusion, free-free absorption may be a reasonable explanation for the spectrum observed in J1641+3454, but also in the other sources examined in this work, because their behavior is essentially identical. It is known that star formation in NLS1s is higher than in regular Seyfert galaxies (Sani et al. 2010). This means that the circumnuclear gas might be ionized both by the AGN and by hot stars, and might act as a screen for the jet at low frequencies. Another possibility is that the passage of the jet in the interstellar medium causes the formation of a cocoon of ionized gas (Wagner & Bicknell 2011; Wagner et al. 2012; Morganti et al. 2015; Morganti 2017), which might also be responsible for the free-free absorption (Bicknell et al. 1997). In the JVLA bands, the radio emission is instead dominated by star-forming activity that occurs farther away from the nucleus, where the absorption becomes negligible. However, more detailed multiwavelength observations are needed to confirm this scenario, especially during the flaring events detected at 37 GHz.
4.6. Astrophysical implications
As mentioned in the introduction, the radio-loudness parameter is still very often used as a sign of the presence of relativistic jets. However, our findings clearly show that this parameter is far from perfect, particularly for sources that belong to population A of the quasar MS. These objects are typically characterized by a high Eddington ratio (Boroson & Green 1992), which is usually associated with a dense circumnuclear environment (Heckman & Best 2014) and with enhanced star formation activity (Chen et al. 2009).
These features can clearly affect the radio emission from population A sources. A high level of star formation significantly increases the radio luminosity of the sources, particularly at low frequencies (e.g., 5 GHz), and in some cases, it can be so strong that the AGN may be classified as radio-loud even without a relativistic jet (Caccianiga et al. 2015; Ganci et al. 2019). On the other hand, the opposite situation can occur in sources such as those we discussed here. If a screen of ionized gas is present around either the nuclear region or the relativistic jet itself, the radio emission will be suppressed at low frequencies, and a jetted object will be classified as radio-quiet (or radio-silent). In the case of a relatively faint relativistic jet produced by a low-mass black hole, radio-loudness can also be deceiving. As shown in the literature, radio-quiet or barely radio-loud sources can harbor relativistic jets, both on parsec (e.g., Mrk 1239, Doi et al. 2015) and kiloparsec scales (e.g., Mrk 783, Congiu et al. 2017). The use of 5 GHz flux density, or any other low frequency, to estimate radio-loudness can therefore be strongly misleading.
This result can also have some consequences on the search for the parent population of γ-ray emitting NLS1s, that is, for the appearance of these aligned objects when they are observed at large angles (for a review, see Berton 2018). It was less clear whether radio-quiet NLS1s had a role in the parent population (e.g., see Berton et al. 2016b, 2018b). Now, it seems that an unknown number of jetted NLS1s may be present within the radio-quiet or radio-silent population. When observed at small angles, these sources may be capable of producing the observed γ-ray emission, and they may therefore complete the picture of the parent population.
Finally, it is also worth noting that if free-free absorption can be so effective in screening relativistic jets among population A objects, there may be a completely unknown population of radio-quiet objects capable of producing γ-ray emission, in analogy with what we see in J1641+3454. Such sources may even be associated with some of the unidentified γ-ray sources that are present in all the Fermi catalogs. Given their lack of radio emission, their association with any nearby radio-quiet AGN would be far from obvious.
In conclusion, a physics-based classification, such as the jetted or non-jetted dichotomy (Padovani 2017), can provide a much more significant view on the nature of AGN. The radio-loudness parameter should instead be used only in extreme cases when nothing else is available, particularly for population A sources, and any result based on it should be taken with extreme care.
5. Summary
We presented the results of new observations carried out with the Very Large Array of seven narrow-line Seyfert 1 galaxies (NLS1) that were formerly classified as radio-quiet or radio-silent. These NLS1s have been detected multiple times during flaring episodes at 37 GHz at Metsähovi Radio Observatory, suggesting that relativistic jets propagate from their core. However, our deep radio observations at frequencies between 1.6 and 9.0 GHz showed that these sources, in analogy with previous observations of radio surveys, are very faint or even not detected. When we consider their low luminosity and brightness temperature, their radio spectrum below 9.0 GHz seems dominated by star-forming activity, while the jet component is completely invisible. At high frequencies, the jet must be present, however, otherwise the detection at Metsähovi would be impossible. This means that their radio spectrum has a convex shape. While the low-frequency regime is dominated by a steep spectrum typical of star formation, we discussed a few possibilities to account for the extremely inverted spectrum that is observed at higher frequencies.
-
Coronal origin: Coronal emission in radio-quiet quasars may appear as a turnover toward high frequencies, and it may be extremely variable. However, the flux densities measured at Metsähovi are one order of magnitude higher than any previous emission attributed to the corona, therefore this solution is unlikely.
-
Synchrotron self-absorption: The inverted part of the spectrum may be the optically thick emission from the relativistic jet that peaks at high frequencies, as seen in extremely young radio galaxies such as high-frequency peakers. However, the kinematic age of the jet predicted by this model is rather young (about 10 years), therefore we would not expect to see many objects of this type.
-
Free-free absorption: NLS1s are well known for their strong star formation, which along with the AGN activity can produce large quantities of ionized gas. The latter might be responsible for screening the jet emission at low frequencies, preventing us from seeing the small-scale jet present in these NLS1s.
This result implies that radio-loudness is not a good parameter to identify relativistic jets in AGN, particularly in NLS1s and in similar sources. If our interpretation is correct, several relativistic jets might be hidden in AGN without any prominent radio emission. Additional observations at higher frequencies are indispensable to fully constrain the spectral behavior of these peculiar sources.
Acknowledgments
G.T. acknowledges partial support by the National Science Foundation under Award No. AST-1909796. The National Radio Astronomy Observatory is a facility of the National Science Foundation operated under cooperative agreement by Associated Universities, Inc. This publication makes use of facilities and data obtained at the Metsähovi Radio Observatory, operated by Aalto University, Finland. This research has made use of the NASA/IPAC Extragalactic Database (NED) which is operated by the Jet Propulsion Laboratory, California Institute of Technology, under contract with the National Aeronautics and Space Admistration.
References
- Antón, S., Browne, I. W. A., & Marchã, M. J. 2008, A&A, 490, 583 [NASA ADS] [CrossRef] [EDP Sciences] [Google Scholar]
- Antonucci, R., & Barvainis, R. 1988, ApJ, 332, L13 [NASA ADS] [CrossRef] [Google Scholar]
- Barvainis, R., & Antonucci, R. 1989, ApJS, 70, 257 [NASA ADS] [CrossRef] [Google Scholar]
- Becker, R. H., White, R. L., & Helfand, D. J. 1995, ApJ, 450, 559 [NASA ADS] [CrossRef] [Google Scholar]
- Behar, E., Baldi, R. D., Laor, A., et al. 2015, MNRAS, 451, 517 [NASA ADS] [CrossRef] [Google Scholar]
- Bellm, E. C., Kulkarni, S. R., Graham, M. J., et al. 2019, PASP, 131, 018002 [NASA ADS] [CrossRef] [Google Scholar]
- Berton, M. 2018, in Revisiting Narrow-line Seyfert 1 Galaxies and their Place in the Universe, 9–13 April 2018, Proc. Sci., 26 [CrossRef] [Google Scholar]
- Berton, M., Foschini, L., Ciroi, S., et al. 2015, A&A, 578, A28 [NASA ADS] [CrossRef] [EDP Sciences] [Google Scholar]
- Berton, M., Caccianiga, A., Foschini, L., et al. 2016a, A&A, 591, A98 [NASA ADS] [CrossRef] [EDP Sciences] [Google Scholar]
- Berton, M., Foschini, L., Ciroi, S., et al. 2016b, A&A, 591, A88 [NASA ADS] [CrossRef] [EDP Sciences] [Google Scholar]
- Berton, M., Foschini, L., Caccianiga, A., et al. 2017, Front. Astron. Space Sci., 4, 8 [NASA ADS] [CrossRef] [Google Scholar]
- Berton, M., Congiu, E., Järvelä, E., et al. 2018a, A&A, 614, A87 [NASA ADS] [CrossRef] [EDP Sciences] [Google Scholar]
- Berton, M., Liao, N. H., La Mura, G., et al. 2018b, A&A, 614, A148 [NASA ADS] [CrossRef] [EDP Sciences] [Google Scholar]
- Berton, M., Congiu, E., Ciroi, S., et al. 2019, AJ, 157, 48 [NASA ADS] [CrossRef] [Google Scholar]
- Berton, M., Björklund, I., Lähteenmäki, A., et al. 2020, Contrib. Astron. Obs. Skaln. Pleso, 50, 270 [Google Scholar]
- Bicknell, G. V., Dopita, M. A., & O’Dea, C. P. O. 1997, ApJ, 485, 112 [NASA ADS] [CrossRef] [Google Scholar]
- Boller, T., Freyberg, M. J., Trümper, J., et al. 2016, A&A, 588, A103 [NASA ADS] [CrossRef] [EDP Sciences] [Google Scholar]
- Boroson, T. A., & Green, R. F. 1992, ApJS, 80, 109 [NASA ADS] [CrossRef] [Google Scholar]
- Boyle, B. J., Cornwell, T. J., Middelberg, E., et al. 2007, MNRAS, 376, 1182 [NASA ADS] [CrossRef] [Google Scholar]
- Caccianiga, A., Antón, S., Ballo, L., et al. 2014, MNRAS, 441, 172 [NASA ADS] [CrossRef] [Google Scholar]
- Caccianiga, A., Antón, S., Ballo, L., et al. 2015, MNRAS, 451, 1795 [NASA ADS] [CrossRef] [Google Scholar]
- Caccianiga, A., Dallacasa, D., Antón, S., et al. 2017, MNRAS, 464, 1474 [NASA ADS] [CrossRef] [Google Scholar]
- Chen, Y.-M., Wang, J.-M., Yan, C.-S., Hu, C., & Zhang, S. 2009, ApJ, 695, L130 [NASA ADS] [CrossRef] [Google Scholar]
- Chen, S., Berton, M., La Mura, G., et al. 2018, A&A, 615, A167 [NASA ADS] [CrossRef] [EDP Sciences] [Google Scholar]
- Condon, J. J. 1992, ARA&A, 30, 575 [NASA ADS] [CrossRef] [MathSciNet] [Google Scholar]
- Condon, J. J., Cotton, W. D., Greisen, E. W., et al. 1998, AJ, 115, 1693 [NASA ADS] [CrossRef] [Google Scholar]
- Congiu, E., Berton, M., Giroletti, M., et al. 2017, A&A, 603, A32 [NASA ADS] [CrossRef] [EDP Sciences] [Google Scholar]
- Cracco, V., Ciroi, S., Berton, M., et al. 2016, MNRAS, 462, 1256 [NASA ADS] [CrossRef] [Google Scholar]
- Doi, A., & Inoue, Y. 2016, PASJ, 68, 56 [NASA ADS] [CrossRef] [Google Scholar]
- Doi, A., Asada, K., Fujisawa, K., et al. 2013, ApJ, 765, 69 [NASA ADS] [CrossRef] [Google Scholar]
- Doi, A., Wajima, K., Hagiwara, Y., & Inoue, M. 2015, ApJ, 798, L30 [NASA ADS] [CrossRef] [Google Scholar]
- Edelson, R. A. 1987, ApJ, 313, 651 [NASA ADS] [CrossRef] [Google Scholar]
- Falcke, H., Bower, G. C., Lobanov, A. P., et al. 1999, ApJ, 514, L17 [NASA ADS] [CrossRef] [Google Scholar]
- Fanti, C., Fanti, R., Dallacasa, D., et al. 1995, A&A, 302, 317 [NASA ADS] [Google Scholar]
- Foschini, L. 2011, in Narrow-Line Seyfert 1 Galaxies and their Place in the Universe, Proc. Sci., NLS1, 24 [NASA ADS] [CrossRef] [Google Scholar]
- Foschini, L. 2012, in Proceedings of Nuclei of Seyfert Galaxies and QSOs − Central Engine & Conditions of Star Formation (Seyfert 2012), Proc. Sci., 10 [Google Scholar]
- Foschini, L. 2014, Int. J. Mod. Phys. Conf. Ser., 28, 1460188 [CrossRef] [Google Scholar]
- Foschini, L. 2017, Front. Astron. Space Sci., 4, 6 [NASA ADS] [CrossRef] [Google Scholar]
- Foschini, L., Berton, M., Caccianiga, A., et al. 2015, A&A, 575, A13 [NASA ADS] [CrossRef] [EDP Sciences] [Google Scholar]
- Fraix-Burnet, D., Marziani, P., D’Onofrio, M., & Dultzin, D. 2017, Front. Astron. Space Sci., 4, 1 [NASA ADS] [Google Scholar]
- Gallo, L. C. 2006, MNRAS, 368, 479 [NASA ADS] [Google Scholar]
- Gallo, L. 2018, in Revisiting Narrow-line Seyfert 1 Galaxies and their Place in the Universe, Proc. Sci., 34 [Google Scholar]
- Ganci, V., Marziani, P., D’Onofrio, M., et al. 2019, A&A, 630, A110 [NASA ADS] [CrossRef] [EDP Sciences] [Google Scholar]
- Giroletti, M., & Polatidis, A. 2009, Astron. Nachr., 330, 193 [NASA ADS] [CrossRef] [Google Scholar]
- Gu, M., Chen, Y., Komossa, S., et al. 2015, ApJS, 221, 3 [NASA ADS] [CrossRef] [Google Scholar]
- Guedel, M., & Benz, A. O. 1993, ApJ, 405, L63 [NASA ADS] [CrossRef] [Google Scholar]
- Heckman, T. M., & Best, P. N. 2014, ARA&A, 52, 589 [Google Scholar]
- Heinz, S., & Sunyaev, R. A. 2003, MNRAS, 343, L59 [NASA ADS] [CrossRef] [Google Scholar]
- Järvelä, E., Lähteenmäki, A., & León-Tavares, J. 2015, A&A, 573, A76 [NASA ADS] [CrossRef] [EDP Sciences] [Google Scholar]
- Järvelä, E., Lähteenmäki, A., Lietzen, H., et al. 2017, A&A, 606, A9 [NASA ADS] [CrossRef] [EDP Sciences] [Google Scholar]
- Järvelä, E., Lähteenmäki, A., & Berton, M. 2018, A&A, 619, A69 [NASA ADS] [CrossRef] [EDP Sciences] [Google Scholar]
- Kellermann, K. I., Sramek, R., Schmidt, M., Shaffer, D. B., & Green, R. 1989, AJ, 98, 1195 [NASA ADS] [CrossRef] [Google Scholar]
- Kollatschny, W., & Zetzl, M. 2011, Nature, 470, 366 [NASA ADS] [CrossRef] [Google Scholar]
- Kollatschny, W., & Zetzl, M. 2013, A&A, 549, A100 [NASA ADS] [CrossRef] [EDP Sciences] [Google Scholar]
- Komatsu, E., Smith, K. M., Dunkley, J., et al. 2011, ApJS, 192, 18 [NASA ADS] [CrossRef] [Google Scholar]
- Komossa, S. 2018, in Revisiting Narrow-line Seyfert 1 Galaxies and their Place in the Universe, Proc. Sci., 15 [CrossRef] [Google Scholar]
- Komossa, S., Voges, W., Xu, D., et al. 2006, AJ, 132, 531 [NASA ADS] [CrossRef] [Google Scholar]
- Kotilainen, J. K., León-Tavares, J., Olguín-Iglesias, A., et al. 2016, ApJ, 832, 157 [NASA ADS] [CrossRef] [Google Scholar]
- Lähteenmäki, A., Järvelä, E., Hovatta, T., et al. 2017, A&A, 603, A100 [NASA ADS] [CrossRef] [EDP Sciences] [Google Scholar]
- Lähteenmäki, A., Järvelä, E., Ramakrishnan, V., et al. 2018, A&A, 614, L1 [NASA ADS] [CrossRef] [EDP Sciences] [Google Scholar]
- Laor, A., & Behar, E. 2008, MNRAS, 390, 847 [NASA ADS] [CrossRef] [Google Scholar]
- Liao, M., & Gu, M. 2020, MNRAS, 491, 92 [NASA ADS] [CrossRef] [Google Scholar]
- Marziani, P., Dultzin, D., Sulentic, J. W., et al. 2018, Front. Astron. Space Sci., 5, 6 [CrossRef] [Google Scholar]
- Mathur, S. 2000, MNRAS, 314, L17 [NASA ADS] [CrossRef] [Google Scholar]
- Morganti, R. 2017, Front. Astron. Space Sci., 4, 42 [NASA ADS] [CrossRef] [Google Scholar]
- Morganti, R., Oosterloo, T., Oonk, J. B. R., Frieswijk, W., & Tadhunter, C. 2015, A&A, 580, A1 [NASA ADS] [CrossRef] [EDP Sciences] [Google Scholar]
- O’Dea, C. P. 1998, PASP, 110, 493 [NASA ADS] [CrossRef] [Google Scholar]
- O’Dea, C. P., & Baum, S. A. 1997, AJ, 113, 148 [NASA ADS] [CrossRef] [Google Scholar]
- Olguín-Iglesias, A., Kotilainen, J. K., León Tavares, J., Chavushyan, V., & Añorve, C. 2017, MNRAS, 467, 3712 [NASA ADS] [Google Scholar]
- Olguín-Iglesias, A., Kotilainen, J., & Chavushyan, V. 2020, MNRAS, 492, 1450 [NASA ADS] [CrossRef] [Google Scholar]
- Oshlack, A. Y. K. N., Webster, R. L., & Whiting, M. T. 2001, ApJ, 558, 578 [NASA ADS] [CrossRef] [Google Scholar]
- Osterbrock, D. E., & Pogge, R. W. 1985, ApJ, 297, 166 [NASA ADS] [CrossRef] [Google Scholar]
- Padovani, P. 2017, Nat. Astron., 1, 0194 [NASA ADS] [CrossRef] [Google Scholar]
- Paliya, V. S. 2019, JApA, 40, 39 [NASA ADS] [Google Scholar]
- Panda, S., Marziani, P., & Czerny, B. 2019, ApJ, 882, 79 [NASA ADS] [CrossRef] [Google Scholar]
- Panessa, F., Baldi, R. D., Laor, A., et al. 2019, Nat. Astron., 3, 387 [NASA ADS] [CrossRef] [Google Scholar]
- Peterson, B. M. 2011, Narrow-Line Seyfert 1 Galaxies and their Place in the Universe, 32 [CrossRef] [Google Scholar]
- Peterson, B., & Dalla Bontà, E. 2018, in Revisiting Narrow-line Seyfert 1 Galaxies and their Place in the Universe, Proc. Sci., 8 [CrossRef] [Google Scholar]
- Planck Collaboration I. 2011, A&A, 536, A14 [NASA ADS] [CrossRef] [EDP Sciences] [Google Scholar]
- Rakshit, S., Stalin, C. S., Chand, H., & Zhang, X.-G. 2017, ApJS, 229, 39 [NASA ADS] [CrossRef] [Google Scholar]
- Sani, E., Lutz, D., Risaliti, G., et al. 2010, MNRAS, 403, 1246 [NASA ADS] [CrossRef] [Google Scholar]
- Schulz, R., Kreikenbohm, A., Kadler, M., et al. 2016, A&A, 588, A146 [NASA ADS] [CrossRef] [EDP Sciences] [Google Scholar]
- Sulentic, J., & Marziani, P. 2015, Front. Astron. Space Sci., 2, 6 [NASA ADS] [CrossRef] [Google Scholar]
- Sulentic, J. W., Zwitter, T., Marziani, P., & Dultzin-Hacyan, D. 2000, ApJ, 536, L5 [NASA ADS] [CrossRef] [Google Scholar]
- Sulentic, J. W., Marziani, P., Zamanov, R., et al. 2002, ApJ, 566, L71 [NASA ADS] [CrossRef] [Google Scholar]
- Tingay, S. J., & de Kool, M. 2003, AJ, 126, 723 [NASA ADS] [CrossRef] [Google Scholar]
- van Breugel, W., Miley, G., & Heckman, T. 1984, AJ, 89, 5 [NASA ADS] [CrossRef] [Google Scholar]
- Vietri, A., Berton, M., Ciroi, S., et al. 2018, in Revisiting Narrow-line Seyfert 1 Galaxies and their Place in the Universe, Proc. Sci., 47 [CrossRef] [Google Scholar]
- Wagner, A. Y., & Bicknell, G. V. 2011, ApJ, 728, 29 [NASA ADS] [CrossRef] [Google Scholar]
- Wagner, A. Y., Bicknell, G. V., & Umemura, M. 2012, ApJ, 757, 136 [NASA ADS] [CrossRef] [Google Scholar]
- Yuan, W., Zhou, H. Y., Komossa, S., et al. 2008, ApJ, 685, 801 [NASA ADS] [CrossRef] [Google Scholar]
All Tables
All Figures
|
Fig. 1. From left to right: maps of J1228+5017 at 1.6 (L), 5.2 (C), and 9.0 GHz (X), respectively. The rms of the maps is 23, 8, and 7 μJy, respectively, the contour levels are at rms × (−3, 3 × 2n), n ∈ [0,3], and beam size 2.77 × 2.32 kpc at 5.2 GHz. |
| In the text | |
|
Fig. 2. From left to right: maps of J1232+4957 at 1.6 (L), 5.2 (C), and 9.0 GHz (X), respectively. The rms of the maps is 21, 7, and 7 μJy, respectively, the contour levels are at rms × (−3, 3 × 2n), n ∈ [0,1], and beam size 2.76 × 2.25 kpc at 5.2 GHz. |
| In the text | |
|
Fig. 3. From left to right: maps of J1510+5547 at 1.6 (L), 5.2 (C), and 9.0 GHz (X), respectively. The rms of the maps is 21, 8, and 7 μJy, respectively, the contour levels are at rms × (−3, 3), and beam size 1.45 × 1.29 kpc at 5.2 GHz. |
| In the text | |
|
Fig. 4. From left to right: maps of J1522+3934 at 1.6 (L), 5.2 (C), and 9.0 GHz (X), respectively. The rms of the maps is 21, 12, and 7 μJy, respectively, the contour levels are at rms × (−3, 3 × 2n), n ∈ [0,4], and beam size 0.73 × 0.66 kpc at 5.2 GHz. |
| In the text | |
|
Fig. 5. From left to right: maps of J1641+3454 :joy:. The rms of the maps is 27, 8, and 7 μJy, respectively, the contour levels are at rms × (−3, 3 × 2n), n ∈ [0,4], and beam size 1.48 × 1.44 kpc at 5.2 GHz. |
| In the text | |
|
Fig. 6. Radio spectra of our sample. The three points below 10 GHz are those measured by the JVLA, while the last point is the average value detected at 37 GHz. The last point was not observed simultaneously with the others. The solid lines represent the spectrum, and the dashed lines connect either upper or lower limits of flux densities and therefore represent limits on the spectral index. |
| In the text | |
Current usage metrics show cumulative count of Article Views (full-text article views including HTML views, PDF and ePub downloads, according to the available data) and Abstracts Views on Vision4Press platform.
Data correspond to usage on the plateform after 2015. The current usage metrics is available 48-96 hours after online publication and is updated daily on week days.
Initial download of the metrics may take a while.