Fig. 6.
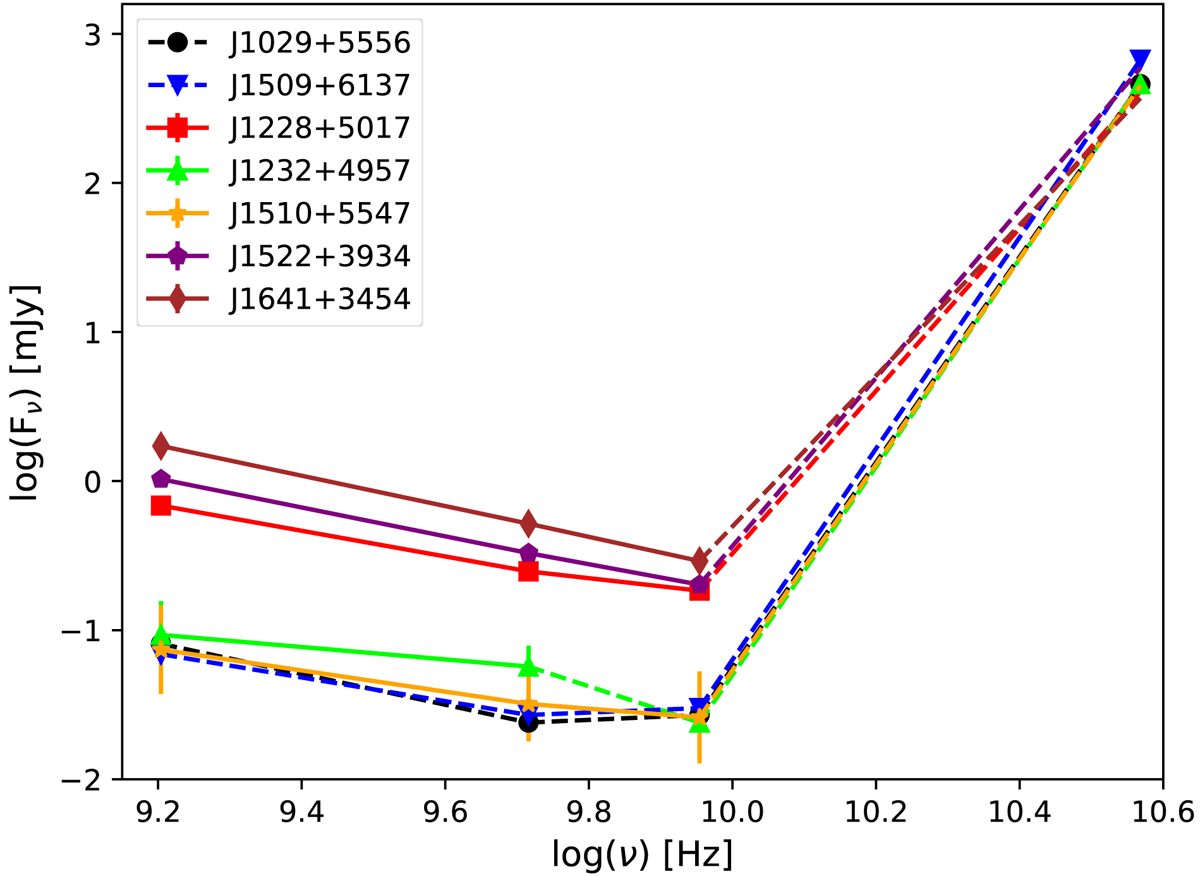
Radio spectra of our sample. The three points below 10 GHz are those measured by the JVLA, while the last point is the average value detected at 37 GHz. The last point was not observed simultaneously with the others. The solid lines represent the spectrum, and the dashed lines connect either upper or lower limits of flux densities and therefore represent limits on the spectral index.
Current usage metrics show cumulative count of Article Views (full-text article views including HTML views, PDF and ePub downloads, according to the available data) and Abstracts Views on Vision4Press platform.
Data correspond to usage on the plateform after 2015. The current usage metrics is available 48-96 hours after online publication and is updated daily on week days.
Initial download of the metrics may take a while.