Fig. 4.
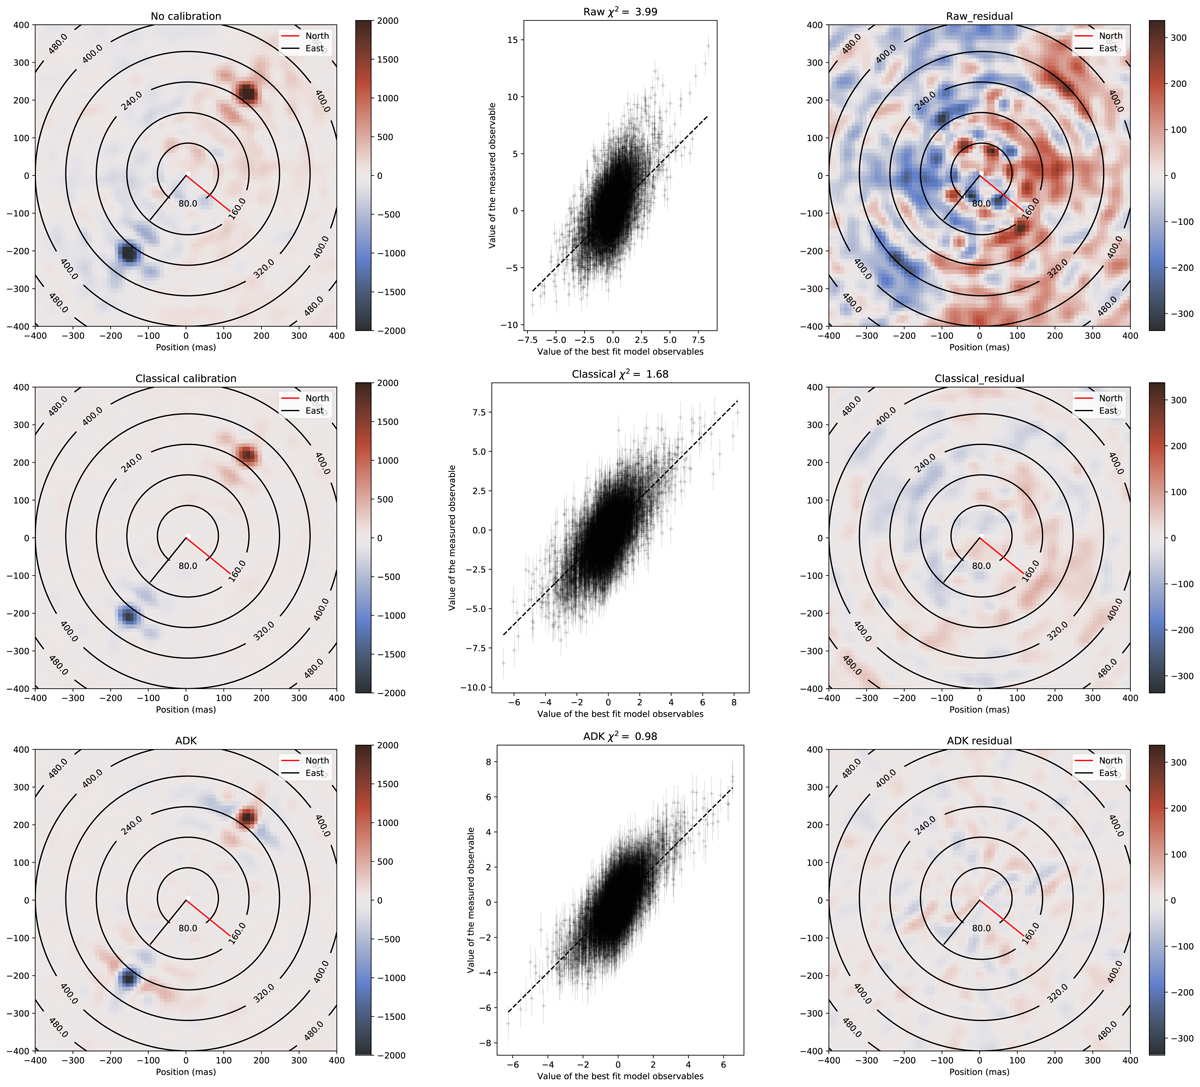
Left: colinearity maps of the region of interest around the target 3 Ser. The orientation corresponds to the orientation on the detector at a parallactic angle of 0 deg. Middle: correlograms corresponding to the final fit with adjusted covariance matrix. The corresponding χ2 is indicated for each plot. Right: colinearity map of the residual, after subtraction of the fitted binary signal. No additional companion is visible. The raw data has a significant amount of residual visible in the background and residual of the colinearity maps, as well as on the residual map. The level of bias is also visible with the poor fitting quality of the fit. ADK and classical calibration show comparable amount of residual background in the colinearity maps, but the χ2 value closer to 1 seem to indicate an even lower level of bias with ADK.
Current usage metrics show cumulative count of Article Views (full-text article views including HTML views, PDF and ePub downloads, according to the available data) and Abstracts Views on Vision4Press platform.
Data correspond to usage on the plateform after 2015. The current usage metrics is available 48-96 hours after online publication and is updated daily on week days.
Initial download of the metrics may take a while.