| Issue |
A&A
Volume 635, March 2020
|
|
|---|---|---|
| Article Number | A175 | |
| Number of page(s) | 11 | |
| Section | Stellar structure and evolution | |
| DOI | https://doi.org/10.1051/0004-6361/201937374 | |
| Published online | 30 March 2020 | |
Theoretical investigation of the Humphreys–Davidson limit at high and low metallicity
1
Armagh Observatory and Planetarium, College Hill, Armagh BT61 9DG, UK
e-mail: erin.higgins@armagh.ac.uk, jorick.vink@armagh.ac.uk
2
Queen’s University of Belfast, Belfast BT7 1NN, UK
3
Dublin Institute for Advanced Studies, 31 Fitzwilliam Place, Dublin, Ireland
Received:
16
December
2019
Accepted:
16
February
2020
Context. Current massive star evolution grids are not able to simultaneously reproduce the empirical upper luminosity limit of red supergiants, the Humphrey–Davidson (HD) limit, nor the blue-to-red (B/R) supergiant ratio at high and low metallicity. Although previous studies have shown that the treatment of convection and semi-convection plays a role in the post-main-sequence (MS) evolution to blue or red supergiants (RSGs), a unified treatment for all metallicities has not been achieved so far.
Aims. We focus on developing a better understanding of what drives massive star evolution to blue and red supergiant phases, with the ultimate aim of reproducing the HD limit at varied metallicities. We discuss the consequences of classifying B and R in the B/R ratio and clarify what is required to quantify a relatable theoretical B/R ratio for comparison with observations.
Methods. For solar, Large Magellanic Cloud (50% solar), and Small Magellanic Cloud (20% solar) metallicities, we develop eight grids of MESA models for the mass range 20–60 M⊙ to probe the effect of semi-convection and overshooting on the core helium-burning phase. We compare rotating and non-rotating models with efficient (αsemi = 100) and inefficient semi-convection (αsemi = 0.1), with high and low amounts of core overshooting (αov of 0.1 or 0.5). The red and blue supergiant evolutionary phases are investigated by comparing the fraction of core He-burning lifetimes spent in each phase for a range of masses and metallicities.
Results. We find that the extension of the convective core by overshooting αov = 0.5 has an effect on the post-MS evolution that can disable semi-convection, leading to more RSGs, but a lack of BSGs. We therefore implement αov = 0.1, which switches on semi-convective mixing, but for standard αsemi = 1 would result in an HD limit that is higher than observed at low Z (Large and Small Magellanic Clouds). Therefore, we need to implement very efficient semi-convection of αsemi = 100, which reproduces the HD limit at log L/L⊙ ∼ 5.5 for the Magellanic Clouds while simultaneously reproducing the Galactic HD limit of log L/L⊙ ∼ 5.8 naturally. The effect of semi-convection is not active at high metallicities because the envelope structure is depleted by strong mass loss such that semi-convective regions could not form.
Conclusions. Metallicity-dependent mass loss plays an indirect, yet decisive role in setting the HD limit as a function of Z. For a combination of efficient semi-convection and low overshooting with standard Ṁ(Z), we find a natural HD limit at all metallicities.
Key words: stars: massive / stars: mass-loss / supergiants / convection / stars: evolution
© ESO 2020
1. Introduction
The maximum luminosity (Lmax) of red supergiants (RSGs) is an important tracer for luminous stellar populations of galaxies (Massey 2003). This limit implies that above a certain luminosity, massive stars do not evolve to the cool supergiant phase but remain compact, evolving towards a blue supergiant (BSG) or Wolf–Rayet (WR) star. Humphreys & Davidson (1979) showed that the maximum luminosity of RSGs, now recognised as the HD limit, was log L/L⊙ ∼ 5.8 for the Milky Way (see also Lamers & Fitzpatrick 1988; Davies et al. 2018).
The HD limit has two key features within the Hertzsprung–Russell diagram, a cool temperature-independent section represented by Lmax, and a hot temperature-dependent section where the most massive stars stay hot and blue. Mass loss probably plays a direct role on the hot side of the HD limit through the relations with temperature, mass, luminosity, and proximity to the Eddington limit. It remains unresolved, however, whether mass loss plays a role in setting the Lmax, although this has important consequences for the progenitors of type II-P supernovae and whether the most massive stars produce direct-collapse black holes. In this study we probe the effects of mass loss and mixing in setting Lmax.
Studies have shown a metallicity dependence of radiatively driven winds Abbott (1982), Kudritzki et al. (1987), Vink et al. (2001), which has been thought to influence the evolution to BSGs and RSGs (e.g. Chiosi & Maeder 1986; Massey 2003; Lamers & Fitzpatrick 1988). There has often been an expectation that the HD limit shifts to higher luminosities at lower metallicity due to the physics of these metallicity-dependent winds. Perhaps surprisingly, Davies et al. (2018) recently showed the HD limit in the Small Magellanic Cloud (SMC) to be similar to or even slightly lower than that of the Large Magellanic Cloud (LMC) (log L/L⊙ ∼ 5.4 − 5.5), thereby challenging the dominance of line-driven winds in setting Lmax. Davies et al. (2018) suggested that there is no evidence for metallicity-dependent winds to be the primary factor in setting the HD limit. In this study, we consider the potential indirect effect of stellar winds by probing its effect on internal mixing and its dependency in setting ereby challenging the Lmax via the length of time spent as an RSG or BSG as a function of metallicity.
Langer & Maeder (1995) considered when investigating a related issue, known as the blue-to-red supergiant (B/R) ratio, that the treatment of convection played a key role in the timescales of hot and cool supergiant phases during helium burning (He burning), particularly mixing processes such as convective overshooting and semi-convection. First studies by van den Bergh & Hagen (1968) showed that the B/R ratio steeply increases with increasing metallicity. Langer & Maeder (1995) scrutinised the B/R ratio in order to determine which physical processes may effect the evolution of O stars to red or blue supergiant phases. While an appreciation for the sensitivity of the B/R ratio to semi-convection and mass loss was made, a unique treatment of these processes has not been reached in reproducing the B/R ratio at varied metallicities. The B/R supergiant problem has been explored over the years with variations of its definition used interchangeably. This has caused inconsistencies within theoretical models and the observed number of supergiants. In particular, reproducing the number of BSGs and RSGs over a range of metallicities has proven unattainable, with some input parameters sufficiently reproducing B/R at high Z and others at low Z. This poses the question whether is there a problem with observations, theory, or both.
Langer & Maeder (1995) presented the problem of predicting the B/R ratio at various Z with theory, while Davies et al. (2018) questioned the observed HD limit as inversely proportional to Z. In order to reconcile these issues between theory and observations, we need to better understand the mechanisms that drive the evolution of O stars to BSG an RSG phases. These studies may also have consequences for the red supergiant problem, reviewed by Davies (2017), concerning the number of red supergiants detected by Smartt et al. (2009) as progenitors of supernovae (SNe). Most massive stars above 8 M⊙ will evolve as RSGs before exploding as SNe, with the type II-P SNe as the most common. Smartt et al. (2009) studied the pre-supernovae data in order to analyse the progenitors of a range of SNe types. When the observed mass distributions were compared with theoretical predictions of RSG populations, a deficiency in SNe from stars with Minit > 17 M⊙, was found that is often referred to as the “red supergiant problem” (see also Kochanek 2020; Davies & Beasor 2020).
In this study we compare variations of internal mixing with a focus on the convective core overshooting parameter (αov) and semi-convection efficiency (αsemi). We explore a wide range of model configurations in order to best fit the evolution of RSGs for a range of metallicities. We provide a grid of galactic, LMC, and SMC models that explores the dependencies of each parameter, and discuss the consequences of our results in Sect. 4.
2. Method
2.1. MESA stellar evolution models
We availed ourselves of the one-dimensional stellar evolution code modules for experiments in stellar astrophysics (MESA) with version 8845 to calculate our models (Paxton et al. 2011, 2013, 2015), adopting physical assumptions from Higgins & Vink (2019) unless specified otherwise. Following our investigation of the MS evolution of massive stars in Higgins & Vink (2019), we focus here on post-MS evolution. In particular, we explore the role of semi-convective mixing in the final stages of H burning and throughout core He-burning. As the convective core recedes during the MS, semi-convective regions form in the envelope above due to the change in the H/He abundance profile. We also investigate the effect of convective core overshooting during core H-burning as it will affect the size of the He core during later burning phases.
The Ledoux criterion1 was implemented for convection, and we employed the mixing length theory as developed by Cox & Giuli (1968) with αmlt = 1.5 (e.g. Jiang et al. 2015; Paxton et al. 2015). We applied semi-convective mixing in post-MS phases with an efficiency, denoted by Langer et al. (1983), of αsemi varied here from 0.1 to 100. We included the effect of overshooting by extending the core by a fraction αov of the pressure scale height Hp, known as step overshooting. We varied this fraction from αov = 0.1 − 0.5 because a modest value of 0.1 was adopted by Ekström et al. (2012), while a moderate value of 0.335 was adopted by Brott et al. (2011), but more recently values of up to 0.5 have been considered (e.g. Higgins & Vink 2019; Schootemeijer & Langer 2018), which has consequences for an extended MS. We applied the “Dutch” wind scheme as the mass-loss recipe, with Vink et al. (2001) active in hydrogen-rich (Xs > 0.7) hot stars (Teff > 10 kK), and de Jager et al. (1988) for cool stars (Teff < 10 kK). We applied rotation of Ω/Ωcrit = 0.4, as in Ekström et al. (2012), and compared with non-rotating models. Rotational instabilities were employed in angular momentum transfer and mixing as described by Heger et al. (2000), although we excluded the effects of rotationally-induced mass loss as in Higgins & Vink (2019) and Müller & Vink (2014).
For the selected initial chemical composition, we adopted a scaled solar heavy element distribution as provided by Grevesse & Sauval (1998). We adopted a solar metallicity of Z = 0.02 (Y = 0.28), with scaled solar mass fractions applied to ZLMC = 0.0088 (YLMC = 0.26) and ZSMC = 0.004 (YSMC = 0.248) for the Magellanic Clouds. We calculated eight grids of models for each metallicity, rotating and non-rotating, high and low overshooting, and efficient and inefficient semi-convective mixing. We determined that this grid specification is sufficient to distinguish which effects are predominant as well as to determine which processes conflict or coalesce. We provide our full grid of models in Fig. A.1.
2.2. Mixing processes
The effects of overshooting are relevant for the core H-burning phase but will have repercussions for later phases because an increased core size will determine the (Mcc)/(MT) ratio. Semi-convection takes effect during the core He-burning phase and dictates the envelope structure for the final phases. Rotational mixing has an effect on internal mixing, but does not influence our results in reproducing the HD limit. While we compare both non-rotating models and Ω/Ωcrit = 0.4 rotating models, we provide an illustration of both models throughout (e.g. Figs. 2–6), although it is important to note that the use of either grid provides qualitatively similar results and as such does not affect our conclusions.
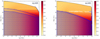 |
Fig. 2. Kippenhahn diagrams of 60 M⊙ rotating models with LMC metallicity and αov = 0.1 (right) or αov = 0.5 (left). The color bar represents the core He abundance to highlight post-MS evolution, whereas blue circles represent convective regions, with hatched blue regions showing an extension of the core by overshooting. White hatched regions illustrate semi-convective mixing. |
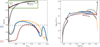 |
Fig. 3. Evolution of 40 M⊙ rotating models with ZLMC, αov = 0.1 and αsemi = 1.0 (orange), 0.1 (blue), 100 (red), and finally αov = 0.5 with αsemi = 1.0 (grey). Left: evolution of the effective temperature as a function of central He abundance, illustrating the fraction of core He-burning spent at RSG and BSG phases. Right: evolutionary tracks shown in an HRD, highlighting a variation of blue loops and RSG evolution. |
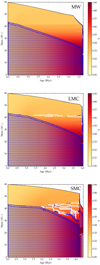 |
Fig. 4. Kippenhahn diagrams for 60 M⊙ models at galactic, LMC, and SMC metallicities with our preferred parameters of very efficient semi-convection and minimal overshooting (αsemi = 100 and αov = 0.1, with rotation). The color bar represents the core He abundance to highlight post-MS evolution, whereas blue circles represent convective regions, with hatched blue regions showing an extension of the core by overshooting. White hatched regions illustrate semi-convective mixing. The envelope mass decreases with increased metallicity, and subsequently decreased semi-convective regions. |
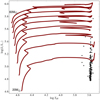 |
Fig. 5. Very efficient semi-convective mixing models with minimal overshooting (αov = 0.1 and αsemi = 100, with rotation) for the mass range 20 M⊙–60 M⊙ (in steps of 5 M⊙) with LMC metallicity (red solid lines). The most luminous RSGs in the LMC adapted from Davies et al. (2018) are plotted here as black triangles as a comparison with our prescription. |
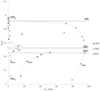 |
Fig. 6. Percentage of time spent during core He-burning as cool RSGs for all 20–60 M⊙ models with αsemi = 100 and αov = 0.1 (non-rotating). The dashed lines represent the observed maximum luminosity of RSGs for each galaxy/our theoretical predictions for the HD limit in each galaxy such that models that lie above these limits must spend less than ∼5% of core He-burning at these cool temperatures. |
The role of semi-convection applies to slow mixing in a region above the convective core where there is stable convection by the Ledoux criterion but unstable by the Schwarzschild criterion (Langer et al. 1985). The efficiency of this mixing is described by a diffusion coefficient that determines how rapidly mixing takes place. Semi-convection affects the hydrogen profile outside the He-burning core, changing the H/He abundance gradient, which in turn alters the structure of the H envelope and causes evolution to either the red or blue supergiant phases. Semi-convection is implemented as a time-dependent diffusive process in MESA where the diffusion coefficient, Dsc, is calculated by Eq. (1), as seen in Langer et al. (1983),
where K is the radiative conductivity, Cp is the specific heat at constant pressure, and αsemi is a free parameter that dictates the efficiency of semiconvective mixing.
Langer & Maeder (1995) highlighted that increased semi-convection leads to a higher number of BSGs, whereas less semiconvection leads to more RSGs. This results from tests with the Schwarzschild criterion, which increases the B/R ratio. Langer & Maeder (1995) found that while the Schwarzschild criterion predicts the ratio for galactic metallicity as observed, and the Ledoux criterion can reproduce the ratio at SMC metallicity, none of the treatments tested were capable of simultaneously reconstructing the B/R ratio at both high and low metallicities. Perhaps the indirect effects of mass loss and mixing with metallicity can provide a better understanding of what sets the HD limit, and whether it remains a hard boundary or merely a short-lived phase.
2.3. Observations in the HRD
The observed Lmax is set by the most massive red supergiants (RSGs) and in the past has been altered due to uncertainties in distances or bolometric corrections (e.g. Davies et al. 2018), but can also be determined by the timescales of the RSG phase at these highest masses. The Lmax of RSGs was observed to be log L/L⊙ max ∼ 5.4 − 5.5 for both the LMC and SMC (Davies et al. 2018). Probability distributions suggested that the SMC Lmax would be slightly lower than that of the LMC, which suggests that Lmax does not increase with decreasing metallicity, and in fact it may be the inverse. Luminosity distributions from this study also highlight a cross-over from RSGs to WRs in both Magellanic Clouds at log L/L⊙ ∼ 5.4 − 5.5, suggesting a possible shift in evolutionary channels.
Although most RSGs in Davies et al. (2018) were observed at log L/L⊙ ∼ 5.4 − 5.5 for both the LMC and SMC, one object in each galaxy was observed to be above the HD limit. This poses the question whether the HD limit is a hard border that physically should not be passed, or if it is an observational artefact based on short timescales spent above the observed maximum luminosity, suggesting that while the most luminous RSGs are prone to small statistics, they may spend a small fraction of core He-burning as RSGs and can be observed as such (see Fig. 5).
3. Results
We explored the effects of semiconvection and overshooting with free parameters αov and αsemi for a range of masses 20–60 M⊙ and metallicities Z⊙, ZLMC, and ZSMC, in order to probe the evolution to RSG or BSG phases. We assumed that the observed HD limit is determined by the luminosity at which massive stars spend a significant fraction of core He-burning at ∼log Teff 3.6 (∼90% tHe). We note the occurrence of blue loops and thus do not define a model as an RSG if it merely dips into the cooler temperature for a short timescale (∼10% tHe). In Sect. 3.1 we explore the evolutionary channels of massive stars that may evolve as RSGs and BSGs. We provide our results for reproducing the HD limit in Sects. 3.2 and 3.3, before we discuss the consequences our results may have on the B/R ratio in Sect. 3.4.
3.1. Evolutionary channels
Chiosi & Maeder (1986) characterised HRD positions by initial mass, with massive stars at Minit > 60 M⊙, moderately massive stars between 25 and 60 M⊙, and low mass massive stars at Minit < 25 M⊙. Massive stars have significant winds that shed the outer envelope, leaving an exposed core that cannot evolve to form a RSG, but more likely evolve to luminous blue variables (LBV) and WR phases. Moderate massive stars form the basis of our study because they likely evolve to form RSGs because the winds are not strong enough to strip the outer envelope at early evolutionary phases. We later find that mixing and mass loss play a combined role in the duration of RSG/BSG phases (see Sect. 3.2), although these processes can be separated in the M–L plane as described in Higgins & Vink (2019). Lower mass stars may evolve quickly to become a RSG during He burning, but undergo blue loops before they return to an RSG. The extension of these blue loops is affected by mass loss and mixing. Low mass massive stars (Minit < 25 M⊙) evolve to become the dominant population of RSGs, which dictates the B/R ratio without reaching the HD limit.
Figure 1 illustrates that for massive stars in the mass range 20–60 M⊙ we observe MS objects that may include O supergiants, B supergiants, and maybe even A supergiants depending on the terminal age main-sequence (TAMS) position (see Sect. 4). The post-MS follows with higher mass (∼40 M⊙) stars spending a large fraction of He-burning as BSGs before evolving up the Hayashi line as a RSG. These more massive RSGs determine Lmax. For ∼20 M⊙, the post-MS may be spent mostly as a RSG, populating the majority of RSGs in the B/R ratio.
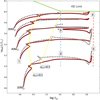 |
Fig. 1. Evolutionary models for 20–60 M⊙ in HRD form, with TAMS positions shown for αov = 0.1, 0.5. Evolutionary phases are highlighted by number with RSGs at the red dashed line, BSGs at the blue dashed line, and the MS before the yellow lines, with the HD limit shown in green. Position 1 shows MS objects, and positions 2 and 5 are post-MS BSGs that may be pre or post-RSGs. Position 3 represents the majority of observed RSGs, while position 4 illustrates the most luminous RSGs. |
The main sequence is represented by position 1 with zero-age main-sequence (ZAMS)-TAMS positions in yellow, followed by BSG and RSG phases. Consequently, the B/R ratio heavily depends on the definition of a BSG and RSG. Figure 1 illustrates that a BSG can be a post-MS object at either pre-RSG or post-RSG phases (positions 2 and 5, respectively). The lower mass RSGs that dominate the population are represented in position 3, while the most luminous RSGs that set the upper luminosity limit are shown in position 4. For some intermediate-mass models, blue loops are observed, showing post-RSG BSGs represented by position 5. In order to distinguish which models spend a sufficient ratio of He-burning as a RSG, we compare the HRD positions from ZAMS to core He-exhaustion to observe a distinct switching of evolution from RSG to BSG and compare the time spent at hot and cool effective temperatures, see Fig. 3.
3.2. HD limit
First comparisons of theoretical models with the observed Hertzsprung-Russell diagram (HRD) by Humphreys & Davidson (1979) suggested an empirical boundary for the luminosity of RSGs in the Milky Way and LMC, which may be primarily due to the effects of metallicity-dependent mass loss at the highest masses. However, Davies et al. (2018) recently found discrepancies between theory and observations at the highest luminosities, suggesting that mass loss may not be primarily responsible for setting the HD limit. Population synthesis models of Davies et al. (2018) with the GENEC code (Ekström et al. 2012) showed a decrease in the time spent at luminosities higher than log L/L⊙ ∼ 5.6 during the cool supergiant phase. This suggests that the empirical boundary may be an observable artefact due to the short timescale of RSGs above Lmax. These models not only predict a decrease in the time spent as a RSG above a certain luminosity, but also find a higher Lmax with lower metallicities due to reduced mass loss, with RSGs expected up to log L/L⊙ ∼ 5.7 − 5.8 in the SMC. Since this is not observed, theory implies that either stars do not evolve to cool supergiants at these higher luminosities or spend such a short time in this phase that it is not likely observed.
After H is exhausted at the centre, massive stars promptly start burning H in a shell and He in their core. This causes the radius to expand as the effective temperature cools in order to radiate the same nuclear energy from the stellar surface. Since the core mass and nuclear burning rate increase, the luminosity also increases along the Hayashi line before exploding as an SNe in the final phase of evolution. The size of the convective core during the MS (Mcc) as a fraction of the total mass (MT) greatly dictates the post-MS evolution of massive stars because this determines how much mass remains in the envelope. Further to this, the envelope structure dictates the effectiveness of semi-convection, which in turn shapes the H/He gradient.
Higgins & Vink (2019) provided an analysis of a MS test-bed binary HD 166734 that suggested an extension of the core by overshooting of up to αov = 0.5. For this reason, we first attempted to reproduce the HD limit with post-MS models for relatively high values of αov = 0.5. We found that when the core is extended by this fraction of the pressure scale height, the areas required to form semi-convective regions were not sufficient to reproduce any BSGs at all, even at low metallicity. Therefore only RSGs were formed, and a cut-off luminosity did not exist. In other words, we could not properly reproduce the HD limit at any metallicity. Figure 2 illustrates the structural changes as a result of enhanced overshooting for a 60 M⊙ model, in which semi-convection does not occur for αov = 0.5. This is due to a lack of capacity for semi-convective regions to form, leading to evolution of RSGs, even when extremely efficient semi-convection is implemented. Hence we find that increased overshooting of αov = 0.5 prevents evolution to BSGs.
However, models with αov = 0.1 show semi-convective regions forming above the core due to the overall lowered fraction of core to total mass ratio (compared to αov = 0.5), which allows semi-convective regions to form in the envelope. These models allow for a combination of red and blue supergiants that can reproduce the HD limit, depending on the effects of their stellar winds with metallicity.
Similarly, the fraction of core mass to total mass may be altered by the natural effect that mass loss plays in depleting the envelope. In environments where the envelope loses enough mass through Z-driven winds, the semi-convective regions, important for dictating RSG/BSG evolution, are prohibited from forming above the core because the envelope structure is not large enough to sustain additional mixing in these unstable regions. It is important to note that in these models it is irrelevant whether very efficient or inefficient semi-convection is assumed because the regions are not developed (Schootemeijer & Langer 2018). Therefore all models with moderately high mass loss, such as Z⊙ models, evolve to RSGs during He burning unless the envelope is stripped by other means, causing WR or LBV-like phases.
In order to constrain the free parameter αsemi and as a result obtain a better understanding of the HD limit over multiple metallicities, we explored each set of models as they evolve through core He-burning, determining the fraction of time spent at hot or cool temperatures (i.e. > 10 kK or < 10 kK) such that RSGs or BSGs would be favoured. We investigated the final status of each model (BSG/RSG) along with the time spent in each phase in order to determine whether a model would be observed as a RSG or BSG. Rather than implementing the MESA default value of unity for the semi-convection efficiency parameter αsemi, we here investigate the outcome of increasing and decreasing this by a factor of 10, similar to that of studies by Schootemeijer et al. (2019). We find that this factor is necessary in altering the efficiency to a notable amount.
An illustration of our selection criteria is shown in Fig. 3, where the HRD (right) shows whether the model evolves to the red or blue, with the core He fraction mapped out as a function of log Teff (left). Figure 3 provides a comparison of core He-burning at cool temperatures (RSG) or hot temperatures (BSG) for a 40 M⊙ star of LMC metallicity with various factors of semi-convective efficiency. We chose this mass range as it is representative of the Lmax (HD limit) where models may switch from RSG to BSG depending on input parameters.
The MS is shown in the upper section of the left plot (Fig. 3) with a green box. The models then diverge at the TAMS with the grey model (αov = 0.5) leaving the MS later. We find that when we increase the core size by overshooting αov = 0.5, which may be preferred at lower masses (∼20–40 M⊙) as found in Higgins & Vink (2019), semi-convective regions are unable to form because the envelope mass is insufficient, therefore the grey model in Fig. 3 evolves to a RSG and remains so until it explodes as a supernova, regardless of metallicity.
All other models have a value of αov = 0.1 and semi-convection was varied from the default value αsemi = 1 (orange). The orange dashed line remains blue through most of the He-burning phase, although it will result in a RSG by core He-exhaustion. Similarly, for low semi-convective efficiency, the blue line representing αsemi = 0.1 spends most of core He-burning as a BSG but later dips to cooler temperatures, forming a RSG. We confirm that less efficient semi-convection leads to a combination of blue and red supergiants, with higher mass models reaching RSG phases but lower mass models remaining blue for most of the evolution, ending the He-burning phase as RSGs. Since observations show the opposite, that is, more RSGs at lower masses (∼20 M⊙) than higher masses (∼60 M⊙), we find that this is not a solution for αsemi in setting the HD limit.
For more efficient semi-convection (αsemi = 100), the red dashed line shows that while this model begins He-burning as a RSG, it appears merely as a loop back into the BSG temperature range where it spends most of the He-burning timescale. Therefore when very efficient semi-convection is applied, models evolve to BSGs above a certain mass (e.g. 55 M⊙ at Z⊙), reproducing the HD limit.
3.3. Unified theory of the HD limit at all Z
Mass loss is decreased at lower metallicity because it depends on metallicity, and the envelope structure is large enough to create larger unstable regions that may be transformed by semi-convection. Therefore semi-convection can be more efficient in lower metallicity environments, leading to more BSGs and therefore a lower HD limit. Similarly, at solar metallicity, the envelope structure would be more depleted than at LMC metallicity, prohibiting large unstable regions from developing. This means that semi-convection is overall less efficient for the same αsemi factor in the Galaxy than at lower metallicities.
Figure 4 illustrates the extent of mass lost from the envelope of a 60 M⊙ model with ΔM ∼ 20 M⊙ at solar metallicity, ΔM ∼ 10 M⊙ at LMC metallicity, and only ΔM ∼ 7 M⊙ at SMC metallicity. This creates a variation in Mcc/MT with metallicity, leading to a higher Lmax in the Milky Way than in the Magellanic Clouds. The final loss of mass during the RSG phase of evolution also has important consequences for the RSG problem and final masses which dictate the fate of these stars.
We find that in order to reproduce the HD limit at all Z, very efficient semi-convection is needed, coupled with a small convective core or Mcc/MT ratio. This can be achieved by lowering the amount of convective overshooting required at the highest masses where BSGs are expected.
Figure 4 demonstrates the effect of metallicity-driven mass loss on semi-convection and furthermore the evolution to RSGs. Each Kippenhahn diagram in Fig. 4 illustrates a rotating 60 M⊙ model with αov = 0.1 and αsemi = 100 for respective metallicities. We present a 60 M⊙ rotating model as a representation of this effect for each metallicity since mass loss plays a dominant role at this mass range. Semi-convective regions increase with decreasing metallicity as a result of a larger envelope mass for one unique set of parameters.
These structures suggest that metallicity-dependent mass loss plays an important role in setting the HD limit as they explain the previously misunderstood increasing HD limit with increased metallicity that provided conflict between theory and observations prior to this study. We hence find an increased HD limit for increased metallicity in line with observations for our models with αsemi = 100. This suggests that increased semi-convective mixing efficiency dominates the evolution, whereas mass loss plays an important indirect role in the effectiveness of semi-convection and BSG/RSG evolution. In low-metallicity environments where mass loss is weaker, internal mixing therefore is predominant.
We present the most luminous RSGs for the LMC adapted from Davies et al. (2018) compared with our preferred set of parameters in Fig. 5 with a rotating set of models of masses 20–60 M⊙ for very efficient semi-convection. Black triangles represent the most luminous RSGs with most below log L/L⊙ = 5.4. At this point, our models with very efficient semi-convection begin blue loops, with masses higher than 35 M⊙ evolving to BSGs rather than RSGs, as we would expect.
Our rotating and non-rotating models with αov = 0.1 and highly efficient semi-convection (αsemi = 100) are consistently able to reproduce the HD limit for three metallicities, see Fig. A.1. Rotating and non-rotating galactic metallicity models result in a HD limit of log L/L⊙ ∼ 5.8 − 5.9, in agreement with the observed maximum luminosity of RSGs in the Milky Way. Both rotating and non-rotating models of LMC and SMC metallicity find a HD limit of log L/L⊙ ∼ 5.4 − 5.5 that reproduces the distribution of RSGs in these lower metallicity environments, as found by Davies et al. (2018).
Figure 6 demonstrates a theoretical HD limit based on the percentage of time spent during core He-burning at cool supergiant effective temperatures. We present our set of models from the calculated grid that was able to reproduce the HD limit at all metallicities. Efficient semi-convection (αsemi = 100) is implemented with minimal core overshooting (αov = 0.1) for core H and He-burning phases, with the indirect effects of stellar winds dominating the post-MS behaviour. Evolutionary models are analysed based on their core He-burning timescale. We compare the time spent at log Teff > 3.6 for BSGs and < 3.6 for RSGs. Although this method determines the effective time spent as a RSG in order to determine the likelihood it would be observed above the empirical HD limit, it also provides useful information for the B/R ratio.
We find that the galactic metallicity models spend 70–90% of all He-burning as a RSG, leaving the Lmax above log L/L⊙ ∼ 5.8. This is due the indirect effect of stellar winds on the envelope structure at this metallicity. In the Magellanic Clouds the RSG timescales are bimodal, with lower mass RSGs (25 M⊙) spending 20–40% of core He-burning as RSG due to their longer lifetimes, reaching 50% at a critical point before decreasing again. The exponentially increasing and decreasing % of time spent as a RSG form the bimodal structure seen in the LMC and SMC models. The critical point corresponds to a theoretical HD limit. The behaviour seen in the Magellanic Clouds is due to the internal mechanisms that drive evolution bluewards or redwards, such as mass loss and semi-convection (see Sect. 3.2). Above the theoretical HD limit where massive stars spend most of the He-burning phase as a BSG, the RSG timescales are < 5% of the overall He-burning time.
For solar metallicity this only occurs at 60–70 M⊙ and above log L ∼ 5.9, while for the Magellanic Clouds all models ≥40 M⊙ spend less than 2% He-burning as a RSG. Table 1 provides the analysis of each model shown in Fig. 6, with the timescales of core He-burning, RSG, and BSG phases. Although this highlights the short timescales that RSGs spend above the HD limit, it also provides the B/R ratio for a range of masses and metallicities. We find that the behaviour seen in the LMC and SMC models, compared to the Milky Way where the behaviour is not bimodal, is a feature of semi-convective mixing being switched on and off respectively.
Timescales for core He-burning models at solar, LMC, and SMC metallicity.
3.4. Implications for the B/R ratio
In Sect. 3 we have presented our results for reproducing the HD limit at multiple metallicities while also comparing the time spent as BSGs and RSGs at the highest luminosities because this is where the HD limit is set. In the following section we discuss the full mass range (20–60 M⊙) because the RSGs formed at 20 M⊙ dominate the B/R ratio as a result of the shape of the initial mass function (IMF).
In reproducing the HD limit from our eight model grid samples, we also analysed the fraction of core He-burning spent as an RSG for a range of masses and metallicities, such that we could determine the likelihood that stars above the HD limit would be observed (see Fig. 6). We find that lower mass models (20–30 M⊙) have a longer He-burning timescale and spend much of the He-burning stage as a BSG before evolving redwards during the later burning phases. This results in a small percentage of He-burning as a RSG before the internal mixing affects the envelope structure, dictating the time spent as a RSG or BSG. At a critical point (35–40 M⊙), models begin to spend 40–50% of the He-burning phase as a RSG as a result of the effects of internal mixing, in particular, efficient semi-convective mixing. The effects are predominately seen in the Magellanic Clouds, where mass loss is reduced.
The behaviour changes at solar metallicity because strong stellar winds affect the envelope structure such that semi-convection does not take place and RSGs are formed at all masses below 60 M⊙ (log L/L⊙ ∼ 5.8). The change in behaviour is present between Z⊙ and ZLMC as a result of the absence or presence of semi-convective regions, previously seen in Fig. 4. At an intermediate metallicity this feature may switch from a high percentage of RSGs as seen at galactic metallicity to the peak seen at ZLMC depending on whether semi-convective regions form or not through the indirect effects of mass loss at a given metallicity.
Observations from Eggenberger et al. (2002) illustrated a clear relationship between the blue-to-red supergiant ratio and metallicity for 45 open clusters, finding that the B/R ratio increased with metallicity. This study followed a series of works on the B/R ratio, although Meylan & Maeder (1982) were the first to examine the B/R ratio with stellar clusters in the Milky Way, LMC, and SMC, finding an increase in B/R ratio by an order of magnitude with an increase in metallicity from ZSMC to Z⊙. Another evaluation of the B/R ratio is determined by variations in metallicity over galactocentric distance (e.g. van den Bergh & Hagen 1968). This method has shown that metal-rich inner sectors of a galaxy have a higher B/R ratio than lower metallicity outer regions. Humphreys & Sandage (1980) demonstrated this for M 33 concluding that the B/R ratio decreases with increasing galactocentric distance. It is important to note that while both sets of studies highlight a positive correlation between B/R ratio and metallicity, in this study we are concerned with defining the B/R ratio in different galaxies such as the Milky Way, LMC, and SMC.
We find that evolutionary models show a decrease in time spent He-burning as a RSG with decreased Z for models 20–30 M⊙, which corresponds to an increased B/R with decreasing Z, counter to observations when O supergiants are included (see Table 1). We discuss below that the observed B/R relation with Z may be polluted by MS objects, which will increase B with Z due to the varied TAMS position with Z. Results from Eggenberger et al. (2002) show that O supergiants dominate the B sample for at least 7 of the 45 clusters studied, suggesting that the observed Z-relation may be a result of categorising B with MS objects as well as post-MS objects.
4. Discussion
The definition of B and R in an observed B/R ratio is important when comparing to theoretical models in order to establish a better understanding of the driving processes that dictate the B/R ratio such as mass loss and mixing. Since the ratio provides information on the post-MS phases, we must exclude MS objects, although a lack of clarity on the TAMS position makes this exclusion difficult to determine.
The blue supergiant population was categorised by Eggenberger et al. (2002) and Langer & Maeder (1995) as O, B and A supergiants; or as O, B supergiants by Meylan & Maeder (1982). However, O supergiants are considered H-burning objects, while B and A supergiants may be either H or He-burning (Vink et al. 2010). By including MS objects, the overall B sample becomes much larger than R for all metallicities, resulting in a high B/R ratio.
The large number of B supergiants found adjacent to O stars in the HRD (without a gap) may suggest that B supergiants are MS objects. Vink et al. (2010) studied the slow rotation rates of B supergiants, which could be explained by bi-stability braking when the wind timescale is sufficiently long, which would require that B supergiants are indeed core hydrogen-burning MS stars. This can be achieved by large core overshooting (Vink et al. 2010). In this case, B supergiants (and perhaps even A supergiants) should not be included in the observed B/R ratio. Alternatively, the slow rotation rates of B supergiants could betray their evolved nature (Vink et al. 2010), in which case B supergiants should be included in the B/R ratio. In other words, as long as we have not solved the related issues of the amount of core overshooting, the location of the TAMS, and the origin of the slow rotation rates of BA supergiants, we are not in a position to have a meaningful comparison of the B/R ratio between observations and theoretical model grids.
If we implement increased overshooting of αov = 0.5 to allow for B supergiants as MS objects at moderate masses (20 − 40 M⊙) but retain a lower overshooting at higher masses (40 − 60 M⊙) to allow for semi-convection, then our B/R ratio can be constrained to post-MS objects that evolve to RSGs and then BSGs. Due to the hotter TAMS at ZLMC, SMC than Z⊙ when increased overshooting is applied, the number of BSGs included as MS or post-MS changes with metallicity. This leads to more O supergiants that are included in B for Z⊙ than for ZSMC, resulting in an increased B/R with metallicity. If we exclude MS objects from the B sample, we may exclude the Z-dependence of B/R, which proves inverse to theory. This requires a detailed analysis of post-MS objects for a range of metallicities with carefully selected criteria for B and R, allowing comparisons with theoretical models.
In Sect. 3 we presented a unified set of input parameters that can reproduce the observed HD limit at varied metallicities. Figure A.1 provides an overview these models for all three metallicities in the form of an HRD (left) and effective temperature with time (right). The core He abundance is mapped, and the colour bar illustrates core He-burning at RSG and BSG effective temperatures. The model configuration included minimal core overshooting (αov = 0.1), which would allow for semi-convective regions to form in the envelope, promoting BSG evolution. Very efficient semiconvection was also needed (αsemi = 100) for sufficient mixing at all metallicities. We find that by core He-exhaustion, both LMC (middle) and SMC (bottom) models show a maximum luminosity of RSGs at approximately log L/L⊙ ∼ 5.5, while for solar metallicity models (top), RSGs are still formed at log L/L⊙ ∼ 5.8 during core He-burning (see Fig. A.1).
We established a second-order effect in mass loss because it plays a more significant role at Z⊙, the envelope becomes more depleted than at lower Z, resulting in fewer semi-convective regions, more RSGs, and a higher observed maximum L of log L/L⊙ ∼ 5.8 (compared to that of ZLMC, SMC where log L/L⊙ ∼ 5.5). The efficiency of semi-convection in lower Z environments is higher because of the lack of mass loss even for αsemi = 0.1, leading to BSGs during most of He burning but RSGs at final stage of He burning. The evolution to RSG phases has implications for pre-SNe and final mass estimates because of the strong stellar winds that are experienced by RSGs. The uncertainty in these mass-loss rates leads to large uncertainties in the final evolution of these stars. Figure 2 illustrates the final decrease in envelope mass during the RSG phase, leaving a 10 M⊙ variation in the final mass of models with αov = 0.1 or 0.5. Since RSG mass-loss rates are increased compared to earlier evolutionary phases, the consequences for increased RSG timescales can be important for determining mass-loss rates for these phases (e.g. Beasor & Davies 2018), which ultimately affects their final masses. This in turn influences the lack of RSGs as SNe progenitors such as in the “red supergiant problem”.
5. Conclusions
We have developed eight grids of models of masses 20−60 M⊙ for solar, LMC, and SMC metallicities to probe the effect of semi-convection and overshooting on the core helium-burning phase (see Fig. A.1). We compared rotating and non-rotating models with high and low semi-convection (αsemi = 0.1 − 100), and with high and low overshooting (αov = 0.1 − 0.5). We confirmed that semiconvective mixing alters the envelope structure such that more blue supergiants (BSGs) are formed with more efficient semi-convection. We found that mass loss and overshooting have indirect effects that dictate the effectiveness of semi-convective regions forming, leading to more RSGs with increased mass loss and overshooting. In order to reproduce the HD limit simultaneously at all metallicities we require low αov ∼ 0.1 at the mass range where the HD limit is set and above (e.g. at 55 M⊙ and above for the Milky Way). This allows semi-convective regions to form that in turn produce BSGs above the HD limit.
We stress that a consistent efficiency of semi-convection may reproduce observations of the most luminous RSGs. Therefore we may constrain the HD limit solely by the efficiency of semiconvection. At higher masses we note that envelope inflation may play a role in the treatment of overshooting and the ratio of Mcc to MT (e.g. Gräfener et al. 2012). However, because the prescription of core overshooting is uncertain, we aim to better constrain the effectiveness of mixing near the core through αov although it may ultimately be attributed to another internal mixing process (such as rotational mixing, perhaps mediated by internal gravity waves or dynamo mechanisms).
We appreciate that although our unique prescription of mixing and mass loss presented in this study is necessary for reproducing the HD limit at various metallicities, it will also have consequences for the B/R ratio. Since we focused on the evolution to RSG and BSG as a final stage of He burning, the dominant mass range under scrutiny is ∼35 − 50 M⊙, which sets the HD limit or maximum RSG luminosity. We find that the HD limit is an observational artefact based on the likelihood of observing a RSG at such short timescales. Our models spend less than 2% of core He-burning as a RSG above the theoretical HD limit for all metallicities. This suggests that while the HD limit sets a preference for BSG evolution above a certain luminosity range, it is possible to observe RSGs above the HD limit, as in Davies et al. (2018).
We present an estimate of the B/R for a range of masses and metallicities, and disentangle the constraints on B and R so that observational studies may be compared to the theory that drives evolution to BSG and RSG phases. Our final set of models are presented in Fig. A.1, demonstrating the core He fraction timescales at RSG and BSG phases for Z⊙, ZLMC, and ZSMC.
Acknowledgments
The authors would like to thank Andreas Sander for constructive comments. We thank the MESA developers for making the MESA code publicly available.
References
- Abbott, D. C. 1982, ApJ, 259, 282 [NASA ADS] [CrossRef] [Google Scholar]
- Beasor, E. R., & Davies, B. 2018, MNRAS, 475, 55 [NASA ADS] [CrossRef] [Google Scholar]
- Brott, I., de Mink, S. E., Cantiello, M., et al. 2011, A&A, 530, A115 [NASA ADS] [CrossRef] [EDP Sciences] [Google Scholar]
- Chiosi, C., & Maeder, A. 1986, ARA&A, 24, 329 [NASA ADS] [CrossRef] [Google Scholar]
- Cox, J. P., & Giuli, R. T. 1968, Principles of Stellar Structure (New York: Gordon and Breach) [Google Scholar]
- Davies, B. 2017, Trans. R. Soc. London Ser. A, 375, 20160270 [NASA ADS] [CrossRef] [Google Scholar]
- Davies, B., & Beasor, E. R. 2020, MNRAS, 493, 468 [NASA ADS] [CrossRef] [Google Scholar]
- Davies, B., Crowther, P. A., & Beasor, E. R. 2018, MNRAS, 478, 3138 [NASA ADS] [CrossRef] [Google Scholar]
- de Jager, C., Nieuwenhuijzen, H., & van der Hucht, K. A. 1988, A&AS, 72, 259 [NASA ADS] [Google Scholar]
- Eggenberger, P., Meynet, G., & Maeder, A. 2002, A&A, 386, 576 [NASA ADS] [CrossRef] [EDP Sciences] [Google Scholar]
- Ekström, S., Georgy, C., Eggenberger, P., et al. 2012, A&A, 537, A146 [NASA ADS] [CrossRef] [EDP Sciences] [Google Scholar]
- Gräfener, G., Owocki, S. P., & Vink, J. S. 2012, A&A, 538, A40 [NASA ADS] [CrossRef] [EDP Sciences] [Google Scholar]
- Grevesse, N., & Sauval, A. J. 1998, Space Sci. Rev., 85, 161 [NASA ADS] [CrossRef] [Google Scholar]
- Heger, A., Langer, N., & Woosley, S. E. 2000, ApJ, 528, 368 [NASA ADS] [CrossRef] [Google Scholar]
- Higgins, E. R., & Vink, J. S. 2019, A&A, 622, A50 [NASA ADS] [CrossRef] [EDP Sciences] [Google Scholar]
- Humphreys, R. M., & Davidson, K. 1979, ApJ, 232, 409 [NASA ADS] [CrossRef] [Google Scholar]
- Humphreys, R. M., & Sandage, A. 1980, ApJS, 44, 319 [NASA ADS] [CrossRef] [Google Scholar]
- Jiang, Y.-F., Cantiello, M., Bildsten, L., Quataert, E., & Blaes, O. 2015, ApJ, 813, 74 [NASA ADS] [CrossRef] [Google Scholar]
- Kochanek, C. S. 2020, MNRAS, submitted [arXiv:2001.07216] [Google Scholar]
- Kudritzki, R. P., Pauldrach, A., & Puls, J. 1987, A&A, 173, 293 [NASA ADS] [Google Scholar]
- Lamers, H. J. G. L. M., & Fitzpatrick, E. L. 1988, ApJ, 324, 279 [NASA ADS] [CrossRef] [Google Scholar]
- Langer, N., & Maeder, A. 1995, A&A, 295, 685 [NASA ADS] [Google Scholar]
- Langer, N., Fricke, K. J., & Sugimoto, D. 1983, A&A, 126, 207 [NASA ADS] [Google Scholar]
- Langer, N., El Eid, M. F., & Fricke, K. J. 1985, A&A, 145, 179 [NASA ADS] [Google Scholar]
- Massey, P. 2003, ARA&A, 41, 15 [NASA ADS] [CrossRef] [Google Scholar]
- Meylan, G., & Maeder, A. 1982, A&A, 108, 148 [NASA ADS] [Google Scholar]
- Müller, P. E., & Vink, J. S. 2014, A&A, 564, A57 [NASA ADS] [CrossRef] [EDP Sciences] [Google Scholar]
- Paxton, B., Bildsten, L., Dotter, A., et al. 2011, ApJS, 192, 3 [Google Scholar]
- Paxton, B., Cantiello, M., Arras, P., et al. 2013, ApJS, 208, 4 [NASA ADS] [CrossRef] [Google Scholar]
- Paxton, B., Marchant, P., Schwab, J., et al. 2015, ApJS, 220, 15 [Google Scholar]
- Schootemeijer, A., & Langer, N. 2018, A&A, 611, A75 [NASA ADS] [CrossRef] [EDP Sciences] [Google Scholar]
- Schootemeijer, A., Langer, N., Grin, N. J., & Wang, C. 2019, A&A, 625, A132 [NASA ADS] [CrossRef] [EDP Sciences] [Google Scholar]
- Smartt, S. J., Eldridge, J. J., Crockett, R. M., & Maund, J. R. 2009, MNRAS, 395, 1409 [NASA ADS] [CrossRef] [Google Scholar]
- van den Bergh, S., & Hagen, G. L. 1968, AJ, 73, 569 [NASA ADS] [CrossRef] [Google Scholar]
- Vink, J. S., de Koter, A., & Lamers, H. J. G. L. M. 2001, A&A, 369, 574 [NASA ADS] [CrossRef] [EDP Sciences] [Google Scholar]
- Vink, J. S., Brott, I., Gräfener, G., et al. 2010, A&A, 512, L7 [NASA ADS] [CrossRef] [EDP Sciences] [Google Scholar]
Appendix A: Grid of models
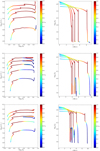 |
Fig. A.1. Left: evolutionary models for solar metallicity (top), LMC (middle), and SMC (bottom), with core He abundance represented by the colour bar. Right: He-burning timescale as a factor of effective temperature, such that RSGs are formed for all solar models, while only short timescales are spent in the red during He burning at lower metallicities. |
All Tables
All Figures
|
Fig. 2. Kippenhahn diagrams of 60 M⊙ rotating models with LMC metallicity and αov = 0.1 (right) or αov = 0.5 (left). The color bar represents the core He abundance to highlight post-MS evolution, whereas blue circles represent convective regions, with hatched blue regions showing an extension of the core by overshooting. White hatched regions illustrate semi-convective mixing. |
| In the text | |
|
Fig. 3. Evolution of 40 M⊙ rotating models with ZLMC, αov = 0.1 and αsemi = 1.0 (orange), 0.1 (blue), 100 (red), and finally αov = 0.5 with αsemi = 1.0 (grey). Left: evolution of the effective temperature as a function of central He abundance, illustrating the fraction of core He-burning spent at RSG and BSG phases. Right: evolutionary tracks shown in an HRD, highlighting a variation of blue loops and RSG evolution. |
| In the text | |
|
Fig. 4. Kippenhahn diagrams for 60 M⊙ models at galactic, LMC, and SMC metallicities with our preferred parameters of very efficient semi-convection and minimal overshooting (αsemi = 100 and αov = 0.1, with rotation). The color bar represents the core He abundance to highlight post-MS evolution, whereas blue circles represent convective regions, with hatched blue regions showing an extension of the core by overshooting. White hatched regions illustrate semi-convective mixing. The envelope mass decreases with increased metallicity, and subsequently decreased semi-convective regions. |
| In the text | |
|
Fig. 5. Very efficient semi-convective mixing models with minimal overshooting (αov = 0.1 and αsemi = 100, with rotation) for the mass range 20 M⊙–60 M⊙ (in steps of 5 M⊙) with LMC metallicity (red solid lines). The most luminous RSGs in the LMC adapted from Davies et al. (2018) are plotted here as black triangles as a comparison with our prescription. |
| In the text | |
|
Fig. 6. Percentage of time spent during core He-burning as cool RSGs for all 20–60 M⊙ models with αsemi = 100 and αov = 0.1 (non-rotating). The dashed lines represent the observed maximum luminosity of RSGs for each galaxy/our theoretical predictions for the HD limit in each galaxy such that models that lie above these limits must spend less than ∼5% of core He-burning at these cool temperatures. |
| In the text | |
|
Fig. 1. Evolutionary models for 20–60 M⊙ in HRD form, with TAMS positions shown for αov = 0.1, 0.5. Evolutionary phases are highlighted by number with RSGs at the red dashed line, BSGs at the blue dashed line, and the MS before the yellow lines, with the HD limit shown in green. Position 1 shows MS objects, and positions 2 and 5 are post-MS BSGs that may be pre or post-RSGs. Position 3 represents the majority of observed RSGs, while position 4 illustrates the most luminous RSGs. |
| In the text | |
|
Fig. A.1. Left: evolutionary models for solar metallicity (top), LMC (middle), and SMC (bottom), with core He abundance represented by the colour bar. Right: He-burning timescale as a factor of effective temperature, such that RSGs are formed for all solar models, while only short timescales are spent in the red during He burning at lower metallicities. |
| In the text | |
Current usage metrics show cumulative count of Article Views (full-text article views including HTML views, PDF and ePub downloads, according to the available data) and Abstracts Views on Vision4Press platform.
Data correspond to usage on the plateform after 2015. The current usage metrics is available 48-96 hours after online publication and is updated daily on week days.
Initial download of the metrics may take a while.