Fig. 3.
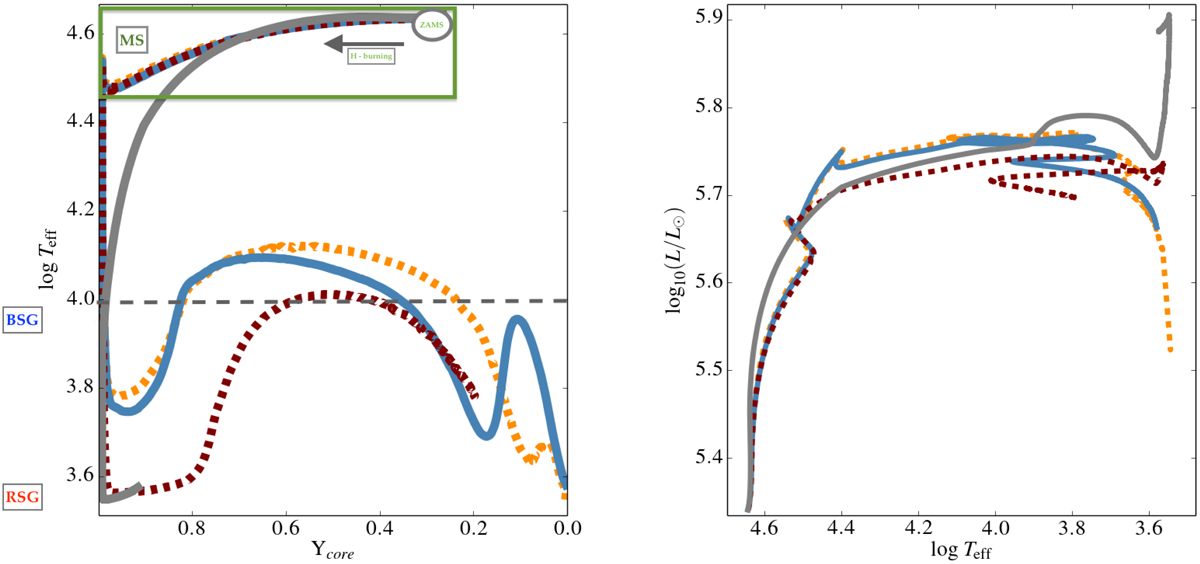
Evolution of 40 M⊙ rotating models with ZLMC, αov = 0.1 and αsemi = 1.0 (orange), 0.1 (blue), 100 (red), and finally αov = 0.5 with αsemi = 1.0 (grey). Left: evolution of the effective temperature as a function of central He abundance, illustrating the fraction of core He-burning spent at RSG and BSG phases. Right: evolutionary tracks shown in an HRD, highlighting a variation of blue loops and RSG evolution.
Current usage metrics show cumulative count of Article Views (full-text article views including HTML views, PDF and ePub downloads, according to the available data) and Abstracts Views on Vision4Press platform.
Data correspond to usage on the plateform after 2015. The current usage metrics is available 48-96 hours after online publication and is updated daily on week days.
Initial download of the metrics may take a while.