Fig. 2.
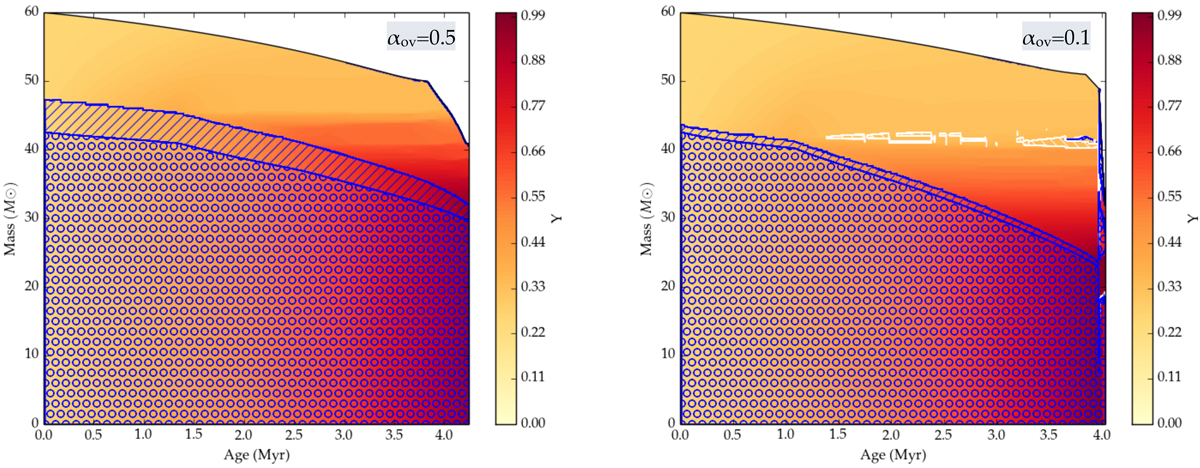
Kippenhahn diagrams of 60 M⊙ rotating models with LMC metallicity and αov = 0.1 (right) or αov = 0.5 (left). The color bar represents the core He abundance to highlight post-MS evolution, whereas blue circles represent convective regions, with hatched blue regions showing an extension of the core by overshooting. White hatched regions illustrate semi-convective mixing.
Current usage metrics show cumulative count of Article Views (full-text article views including HTML views, PDF and ePub downloads, according to the available data) and Abstracts Views on Vision4Press platform.
Data correspond to usage on the plateform after 2015. The current usage metrics is available 48-96 hours after online publication and is updated daily on week days.
Initial download of the metrics may take a while.