Fig. 1.
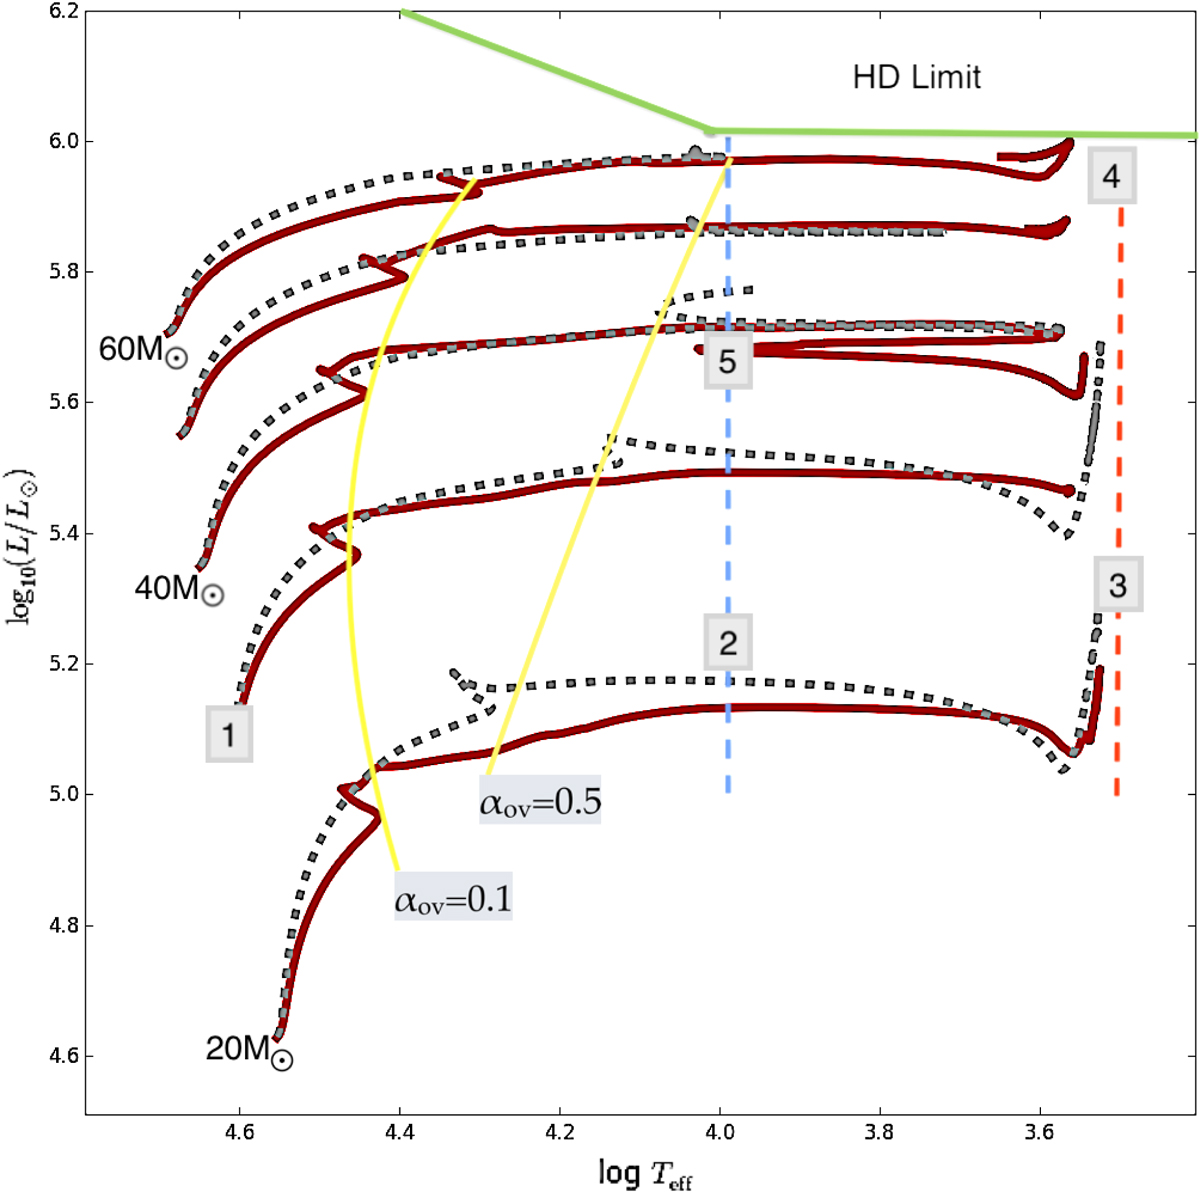
Evolutionary models for 20–60 M⊙ in HRD form, with TAMS positions shown for αov = 0.1, 0.5. Evolutionary phases are highlighted by number with RSGs at the red dashed line, BSGs at the blue dashed line, and the MS before the yellow lines, with the HD limit shown in green. Position 1 shows MS objects, and positions 2 and 5 are post-MS BSGs that may be pre or post-RSGs. Position 3 represents the majority of observed RSGs, while position 4 illustrates the most luminous RSGs.
Current usage metrics show cumulative count of Article Views (full-text article views including HTML views, PDF and ePub downloads, according to the available data) and Abstracts Views on Vision4Press platform.
Data correspond to usage on the plateform after 2015. The current usage metrics is available 48-96 hours after online publication and is updated daily on week days.
Initial download of the metrics may take a while.