| Issue |
A&A
Volume 633, January 2020
|
|
|---|---|---|
| Article Number | A33 | |
| Number of page(s) | 13 | |
| Section | Planets and planetary systems | |
| DOI | https://doi.org/10.1051/0004-6361/201936700 | |
| Published online | 03 January 2020 | |
The origin of the high metallicity of close-in giant exoplanets
Combined effects of resonant and aerodynamic shepherding
1
Department of Earth and Planetary Science, Graduate School of Science, The University of Tokyo,
7-3-1 Hongo,
Bunkyo-ku,
Tokyo
113-0033,
Japan
e-mail: This email address is being protected from spambots. You need JavaScript enabled to view it.
2
Institute for Computational Science, Center for Theoretical Astrophysics & Cosmology, University of Zurich Winterthurerstr. 190, 8057 Zurich, Switzerland
3
Research Center for the Early Universe (RESCEU), Graduate School of Science, The University of Tokyo,
7-3-1 Hongo,
Bunkyo-ku,
Tokyo
113-0033,
Japan
Received:
14
September
2019
Accepted:
5
November
2019
Abstract
Context. Recent studies suggest that in comparison to their host star, many giant exoplanets are highly enriched with heavy elements and can contain several tens of Earth masses of heavy elements or more. Such enrichment is considered to have been delivered by the accretion of planetesimals in late formation stages. Previous dynamical simulations, however, have shown that planets cannot accrete such high masses of heavy elements through “in situ” planetesimal accretion.
Aims. We investigate whether a giant planet migrating inward can capture planetesimals efficiently enough to significantly increase its metallicity.
Methods. We performed orbital integrations of a migrating giant planet and planetesimals in a protoplanetary gas disc to infer the planetesimal mass that is accreted by the planet.
Results. We find that the two shepherding processes of mean motion resonance trapping and aerodynamic gas drag inhibit the planetesimal capture of a migrating planet. However, the amplified libration allows the highly-excited planetesimals in the resonances to escape from the resonance trap and to be accreted by the planet. Consequently, we show that a migrating giant planet captures planetesimals with total mass of several tens of Earth masses if the planet forms at a few tens of AU in a relatively massive disc. We also find that planetesimal capture occurs efficiently in a limited range of semi-major axis and that the total captured planetesimal mass increases with increasing migration distances. Our results have important implications for understanding the relation between giant planet metallicity and mass, as we suggest that it reflects the formation location of the planet – or more precisely, the location where runaway gas accretion occurred. We also suggest the observed metal-rich close-in Jupiters migrated to their present locations from afar, where they had initially formed.
Key words: planets and satellites: composition / planets and satellites: formation / planets and satellites: gaseous planets / celestial mechanics / methods: numerical
© ESO 2020
1 Introduction
Many close-in giant exoplanets that have been detected are found to be highly enriched with heavy elements when compared to the stellar composition, with several of the planets containing several hundreds of Earth-mass of heavy elements (Guillot et al. 2006; Miller & Fortney 2011; Thorngren et al. 2016). The origin of this enrichment, however, is poorly understood. One might think that giant planets formed by core accretion have metallicities (or core-to-envelope mass ratios) higher than those of the host stars. This is not necessarily true since the mass of the core that formed before the onset of the runaway gas accretion is at most ~20–30 Earth masses (e.g. Pollack et al. 1996; Ikoma et al. 2006; Lambrechts et al. 2014). Further enrichment of the planet during runaway gas accretion is difficult; indeed, theoretical studies show that only several Earth masses of heavy elements can be captured in situ during the gas accretion phase when a minimum-mass solar nebula is assumed (Zhou & Lin 2007; Shiraishi & Ida 2008; Shibata & Ikoma 2019). If the solid mass is several times higher than the heavy-element mass of the minimum-mass solar nebula, the enrichments of Jupiter and Saturn could be explained by such an in situ accretion during the gas accretion stages (Shibata & Ikoma 2019). However, the accreted masses are found to be significantly smaller than the inferred several tens (or more) of Earth masses of the detected warm-Jupiters (Thorngren et al. 2016). In addition, Thorngren et al. (2016) found a relation between the heavy-element mass and planet mass that has to be explained.
Enrichment of gas giants during their formation process has recently been investigated by several groups. Bitsch et al. (2019) studied the formation of planetary systems considering pebble accretion and Booth et al. (2017) investigated the enrichment of the planetary envelop considering the composition evolution of disc gas due to pebbles. Their results suggest that pebble accretion is not sufficient to explain the inferred amount of heavy elements in close-in giant planets. Indeed, the asteroid belt population in our solar system suggests that large planetesimals do form, and could be available for capture during planetary growth (Morbidelli et al. 2009; Johansen et al. 2015). In addition, a recent formation model of Jupiter suggests that planetesimal accretion is required to explain the separation of solids in the early solar system (Alibert et al. 2018).
Using empirical formulae for in situ accretion rates of planetesimals and pebbles available in the literature, Hasegawa et al. (2018) investigated the metallicity enhancement of close-in planets and found that the metallicity increases with the planetary mass. However, they have not studied the absolute amount of heavy elements in the planet, which remains unknown. In this study, we focus on the actual captured mass of planetesimals and its dependence on various model assumptions. In particular, we investigate the effects of planetary migration on the capture of planetesimals, since most of the giant exoplanets that are found to be enriched have short orbits and are expected, therefore, to experience significant migration after their formation.
During its orbital migration, a gas giant planet encounters many planetesimals and captures some of them. Tanaka & Ida (1999) performed N-body simulations of the dynamics of planetesimals and a migrating protoplanet. Jupiter’s enrichment with heavy elements during its formation when migration is included was presented by Alibert et al. (2005). Both studies neglected the effects of mean motion resonances, which should be considered since they significantly affect the planetesimals orbital evolution during planetary migration (Batygin & Laughlin 2015). Currently, the efficiency of planetesimal accretion during planetary migration remains unknown.
The main goal of this study is to investigate the basic physics of planetesimal capture by a migrating gas giant planet, and explore whether this process can explain the inferred enrichments of close-in giant exoplanets. Our paper is organised as follows. In Sect. 2, we describe the basic model and settings used in this study. We construct a reference model, which is explained inSect. 2.4. In Sect. 3, we investigate the capture process using the reference model. The basic physics of planetesimal capture by a migrating planet is analysed in detail. In Sect. 4, we perform parameter studies and investigate the sensitivity of the inferred captured mass to the assumed parameters. We compare our results with observations in Sect. 5.1 and discuss the limitations of our model in Sect. 5.3. A summary of the study and its conclusions are presented in Sect. 6.
2 Method and model
In this study we assume the following situation: a giant planet was formed after gas accretion stopped and the planet is no longer growing in mass. The planet then opens a gap and migrates radially inward in the type-II mode from a given semi-major axis in a circumstellar disc. Initially, there are many single-sized planetesimals inside the planet’s orbit. The migrating planet then encounters these planetesimals and captures some of them. Planetesimals are represented by test particles and, therefore, they are affected only by the gravitational forces from the central star and planet, and the drag force by the disc gas. The dynamical integration for these bodies is performed using the numerical simulation developed in Shibata & Ikoma (2019), where the detailed scheme and benchmark results are described.
2.1 Forces exerted on planetesimals and planets
The equation of motion is given by
 (1)
(1)
where t is the time, ri is the position vector relative to the initial (i.e. t = 0) mass centre of the star-planet-planetesimals system, fgrav(i, j) is the mutual gravity between particles i and j given by
 (2)
(2)
with ri,j being the position vector of particle i relative to particle j (ri,j ≡|ri,j|), Mj is the mass of particle j, and G is the gravitational constant, fgas is the aerodynamic gas drag, and ftid is the gravitational tidal drag from the circumstellar-disc gas. The central star, planet, and planetesimals are denoted by the subscripts i (or j) = 1, 2, and ≥3, respectively. The planetesimals are treated as test particles; therefore fgrav(i, j) = 0 in Eq. (1) for j ≥ 3. Also, given the range of the planetesimals mass (~ 1016–1022 g) and planet (~1030 g), we assume ftid = 0 for the former and fgas = 0 for the latter. The central star is not affected by fgas and ftid.
2.1.1 Aerodynamic gas drag
The aerodynamic gas drag force is given by (Adachi et al. 1976)
 (3)
(3)
Here u is the velocity relative to the ambient gas (u = |u|), τaero is the damping timescale of aerodynamic gas drag, mpl is the planetesimal’s mass, Cd is the non-dimensional drag coefficient (see Appendix A), ρgas is the gas density, and Rpl is the planetesimal’s radius. The velocity and density of the ambient disc gas are calculated from the circumstellar disc model (see Sect. 2.2).
2.1.2 Gravitational tidal drag
We also consider the effect of the type-II migration of the gas giant planet, using the following form of the tidal drag force,
 (4)
(4)
where vp and τtid,a are the planet’s velocity and the damping timescale of the semi-major axis, respectively. In this formula, the planet’s eccentricity is assumed to be negligibly low. As for τtid,a, we consider type II migration, with the dependence on the planet’s semi-major axis ap being:
 (5)
(5)
where the constant τtid,0 is set as a free parameter. Equation (5) does not depend on the planet’s mass and the disc properties as shown by (Ida & Lin 2004). However, this simplification allows for a systematic investigation of the effect of planet migration on the efficiency of planetesimal capture and global enrichment.
2.2 Disc model
We adopt the so-called self-similar solution for the surface density Σss, which is expressed as (Lynden-Bell & Pringle 1974)

where Mdisc,0 is the initial total disc mass, Rm is the radial scaling length of circumstellar disc, t0 is the time when the planetary migration begins, and τs is the characteristic time of viscous evolution defined as  with νm being the viscosity at r = Rm. Equation (6) is derived under the assumption of the Keplerian-rotating disc with the temperature profile of T ∝ r−1∕2 and the α-prescription for turbulent viscosity from Shakura & Sunyaev (1973). It should be noted that
  remains fixed during the simulation, which means that Σss depends solely on t0, the time at which the planet starts migrating. This simplification allows for a systematic investigation of the planetesimal accretion efficiency.
The gap’s structure is modelled in the same way as in Shibata & Ikoma (2019); namely, we use the empirical formula for the radial density profile in the gap derived from the two-dimensional hydrodynamical simulations of Kanagawa et al. (2017). Combining the surface density profiles of the circumstellar disc and the gap, we express the gas surface density Σgas as
 (8)
(8)
where fgap is the window function representing the effect of gap opening (see Appendix B). Examples of the radial profiles of Σgas are shown in Fig. 1. Also, assuming the circumstellar disc to be vertically isothermal, the gas density ρgas is expressed as
 (9)
(9)
where z is the height from the disc’s mid-plane and hs is the disc’s scale height.
The gas in the circumstellar disc rotates with a sub-Keplerian velocity vK because of the pressure gradient; namely
 (10)
(10)
with η defined as
 (11)
(11)
where Pgas is the gas pressure. For deriving the above equation, we assume η ≪ 1 and use the ideal-gas relation for isothermal sound speed, i.e.  = Pgas∕ρgas.
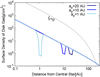 |
Fig. 1 Example of the disc’s surface density during planetary migration with t0 = 3 × 10⁶ yr. The disc’s surface density is shown as a function of distance from the central star. Solid lines show the radial profiles with gap opening for different locations of the planet as indicated in the legend. Black-dotted line shows the surface density of disc gas for t0 = 0. |
2.3 Treatment of planetesimals
We assume that the evolution of planetesimal disc is decoupled from that of the gas disc and the initial surface density of solids Σsolid is related to the surface density of gas by
 (12)
(12)
where Zs is the solid-to-gas ratio, which is assumed to be equal to the metallicity of the central star, and fsolid is a factor regarding the composition of planetesimals; in this study, we assume the planetesimals are purely rock and ice mixed with rock interior and exterior to the snow line, respectively, and fsolid is given as (Hayashi 1981)
![Mathematical equation: \begin{align*}f_{\textrm{solid}} (r) =\left\{\!\! \begin{array}{ll} 0.24 & \text{for $T(r) > T_{\textrm{ice}}$}, \\[3pt] 1.0 & \text{for $T(r) < T_{\textrm{ice}}$}, \end{array} \right. \end{align*}](/articles/aa/full_html/2020/01/aa36700-19/aa36700-19-eq15.png) (13)
(13)
where Tice is the sublimation temperature of water ice, 170 K. The temperature of the circumstellar disc T is given by:
 (14)
(14)
where Tm is the disc gas’ temperatureat r = Rm. The planetesimal’s mass mpl is calculatedas  , where ρpl is the planetesimal’s mean density.
We follow the orbital motion of super-particles, each of which contain several equal-sized planetesimals. The super-particles are distributed in a given radial region uniformly, where the inner and outer edges are denoted by ain and aout, respectively. The surface number density of super-particles is ∝ r−1. The mass per super-particle msp is given by
 (15)
(15)
where a0 is the initial semi-major axis of the super-particle, Nsp is the number of super-particles used in a given simulation, and fdisc is the mass ratio of the initial circumstellar disc to the central star.
During the orbital integration, we judge that a super-particle has been captured by the planet once (i) the super-particle enters the planet’s envelope or (ii) its Jacobi energy becomes negative in the Hill sphere. The planet’s radius Rp is calculated as
 (16)
(16)
where ρp is the planet’s mean density, and we set ρp = 0.125 g cm−3. The Jacobi energy is defined as (e.g. Murray & Dermott 1999)

where (x′, y′) and  are, respectively,the position and velocity of the planetesimal in the coordinate system co-rotating with the planet. The constant U0 is set such that UJ vanishes at the Lagrange L2 point. With orbital elements, the Jacobi energy of a planetesimal is approximately expressed as (Hayashi et al. 1977)
 (19)
(19)
where a, e and i are the planetesimal’s semi-major axis, eccentricity and inclination and h is the reduced Hill radius defined as
 (20)
(20)
The region of EJ > 0 corresponds the so-called feeding zone, inside which planetesimals can enter the planet’s Hill sphere.
Parameters used in the reference model.
2.4 Model settings
In Sect. 3, we investigate the basic physics of the process of planetesimal capture by the migrating gas giant planet. The planet is initially located at a semi-major axis ap,int and migrates inward as determined by Eq. (4). The calculation is artificially stopped once the planet reaches the orbit of ap,fnl. The planetesimals are initially distributed outside the initial feeding zone of the planet, namely  . The choices for the parameter values for the reference model are summarised in Table 1. In Sect. 4, we perform a parameter study for different values of τtid,0, Rpl, ap,int and Mp and investigate their effect on the captured heavy-element mass.
Again, in this study, in order to focus on the effect of planetary migration on the planetesimal capture process, we do not consider planetary growth nor disc evolution. While our set-up is simplified, it allows us to identify the parameters that strongly influence the planetesimals orbital evolution and the efficiency of planetesimal capture. This is discussed in detail in Sect. 5.
3 Reference model results
3.1 Dynamics of planetesimals around a migrating planet
Figure 2 shows three snapshots of the orbital evolution of planetesimals for the reference case in the semi-major axis versus the eccentricity plane. In each panel, the migrating planet is represented by the orange circle, while planetesimals of EJ > 0 and EJ < 0 are indicated by the red and blue circles, respectively. The positions of the three mean motion resonances (MMRs) with the planet are indicated by the green dotted lines. The orbital evolution of planetesimals is summarised below.
Panel a: as the planet migrates inward, planetesimals encounter and are trapped in the MMRs; this phenomenon is referred as resonant trapping. The planetesimals trapped in the MMRs are transported inward together with the migrating planet and their eccentricities are highly enhanced. This phenomena is known as resonant shepherding (Batygin & Laughlin 2015).
Panel b: over the course of time, the resonantly-trapped planetesimals start to escape from the MMRs. This is because the stronger aerodynamic drag in inner regions allows the planetesimals to escape from the MMRs. Such breakup of resonant trapping was found by Malhotra (1993) in the context of the formation of Jupiter’s core.
Panel c: in the further inner region, the disc gas becomes dense enough so that the resonantly trapped planetesimals have their eccentricities damped faster than the planetary migration, and therefore they are outside the feeding zone. We refer to this phenomenon as aerodynamic shepherding (e.g. Tanaka & Ida 1999, for terrestrial planet formation).
Figure 3 shows the temporal changes in the cumulative mass of captured planetesimals. The semi-major axis of the migrating planet is shown in the top x-axis. We find that most of the accreted planetesimals are captured mainly during the period between 4 × 10⁵ and 6 × 10⁵ yr, when the planet migrates from 6 to 2 AU. As shown in Fig. 2, the resonant shepherding and the aerodynamic shepherding are significant for t ≲ 4 × 10⁵ yr and t ≳ 6 × 10⁵ yr, respectively.Most of the planetesimals are captured when both shepherding processes are inefficient. This result suggests that resonant shepherding and aerodynamic shepherding inhibit planetesimal capture by a migrating giant planet. The cumulative captured mass at the end of the calculation (hereafter, the total captured mass  ) is found to be ~20 M⊕, which is ~ 20% of available planetesimal mass (~100 M⊕ planetesimals are distributed at the beginning of the simulation). A detailed analysis of the shepherding processes is given in Appendix C.
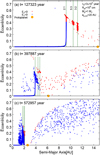 |
Fig. 2 Snapshots of the orbital evolution of planetesimals for (a) t = 127 323 yr, (b) 397 887 yr, and (c) 572 957 yr in the reference case (see Table 1 for the setting). Horizontal and vertical axes are the semi-major axis and eccentricity, respectively. Red and blue circles indicate the planetesimals with positive and negative Jacobi energy, respectively; orange circle represents the migrating planet. Green dotted lines indicate the positions of 2:1, 5:3, and 3:2 mean motion resonances with the planet. |
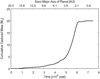 |
Fig. 3 Temporal changes in the cumulative mass of captured planetesimals in the reference case (see Table 1 for the setting). Top x-axis shows the semi-major axis of the migrating planet. |
3.2 Dependence on the initial semi-major axis
Figure 4 shows the fraction of captured planetesimals as a function of their source semi-major axis a0. From a physical point of view, the histogram can be divided into three regions including (1) a0 < 5 AU, (2) 5 AU < a0 < 12.6 AU, which corresponds to the initial 2:1 MMR, (3) 12.6 AU < a0. In the first region, the fraction is quite small and decreases with decreasing a0. Those from the second region are trapped in the 2:1 MMR and then about 30–40% of them are captured by the planet. The planetesimals from the third region are trapped in the 5:3 or 3:2 MMRs and then about 10–20% of them are captured by the migrating planet.
In the first region, the dominant shepherding process is the aerodynamic one. Since it works more effectively in inner regions, the number of planetesimals that enter the planetary feeding zone decreases along with the decreasing initial semi-major axis.
The difference in capture probability between the second and third regions arises from the difference of the MMRs by which planetesimals are initially trapped. As a result, the dynamical configuration of planetesimals inside the feeding zone is changed. The main difference is the planetesimal eccentricity; the eccentricity of planetesimals from the third region is higher than that of planetesimals from the second region (see Appendix C). Since the capture probability decreases with increasing eccentricity (Ida & Nakazawa 1989), the capture probability for the third region is smaller than that of the second.
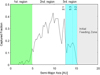 |
Fig. 4 Fraction of planetesimals captured by the planet versus their source semi-major axis for the reference case. Green, white, and turquoise areas correspond to the first, second, and third regions, respectively, denoted in Sect. 3.2. The difference between these regions is due to the different nature of the dominant shepherding process. Gray area shows the initial planetary feeding zone for planetesimals in circular orbits (e = 0). Dotted lines indicate the positions of the 2:1, 5:3, and 3:2 MMRwith the planet at the beginning of the simulation. The bin width of the histogram is 1∕3 AU. |
4 Results of the parameter study
As discussed above, the two shepherding processes control the efficiency of planetesimal capture by a migrating planet. In this section, we perform a parameter study whereby we change the planet’s migration timescale τtid,0, the radius of planetesimals Rpl, the migration length (or the initial position of the planet ap,int), and the planet’s mass Mp, in order to investigate the effects of these parameters on the shepherding and the capture processes of planetesimals.
The panels in the left column of Fig. 5 present the dependence of the total mass of planetesimals captured by the planet,  , on (a-1) τtid,0, (b-1) Rpl, (c-1) ap,int and ((d)-1) Mp. The right column shows the fraction of planetesimals captured by the planet as a function of their source semi-major axis a0 for the different cases we consider.
In panel a-1, we present the values of  calculated for log (τtid,0∕yr) = 4.0, 4.5, 5.0, 5.5, and 6.0. It is found that
  increases with τtid,0 for 104.0 ≤ τtid,0 ≤ 104.5 yr, while decreasing with τtid,0 for τtid,0 ≥ 104.5 yr. Two such different trends arise because change in τtid,0 affects both types of shepherding in different ways. Aerodynamic shepherding becomes more effective for larger τtid,0, because slower planetary migration makes planetesimals subject to aerodynamic gas drag for a longer time. Consequently, as found in panel a-2, the fraction of captured planetesimals from inner regions decreases with increasing τtid,0. On the other hand, resonant shepherding becomes less effective for larger τtid,0, because the excitation of planetesimal eccentricity in MMRs weakens with increasing τtid,0. As a result of the combination of both shepherdings,
  peaks at τtid,0 = 104.5 yr (see Appendix C for more details).
In panel b-1,  is found to increase with Rpl: this is simply because larger Rpl brings about weaker aerodynamic gas drag and thereby less effective aerodynamic shepherding. Since several studies have suggested that planetesimals are likely to be born as big as ~ 100 km, an enrichment of several 10 M⊕ is expected. In panel c-1,
  is found to increase with the migration length almost linearly. Both shepherding processes are almost independent of the migration length, so
  is determined by the number of planetesimals that interact with the planet during its migration.
Finally, in panel d-1,  is found to change with Mp in a non-monotonic manner and take local maxima at Mp = 1.4 MJ and 5.7 MJ and local minima at Mp = 0.7 MJ and 2.8 MJ. In panel d-2, the capture fractions are shown for those local maxima and minima cases. The reason for such a non-monotonic change in
  with Mp is linked to the position of MMRs relative to the feeding zone boundary. The change in the planet’s mass shifts the cross points between the feeding zone boundary and MMRs, because the feeding zone expands with Mp (Eq. (19)). Planetesimals enter the feeding zone around these cross points (see Figs. C.1 and C.2); hereafter, these points are referred to as channels. The shift of channels is monotonic with Mp. But the main channel, which supplies most of the planetesimals into the feeding zone, also changes with Mp, which results in the non-monotonic change in
  with Mp. The details of this mechanism are presented in Appendix D.
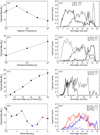 |
Fig. 5 Results of the parameter study. Left column: total mass of captured planetesimals as a function of (a)-1: the migration timescale of the planet, τtid,0, (b)-1: the radius of planetesimals, Rpl, (c)-1: the initial semi-major axis of the planet ap,int, and (d)-1: the mass of the planet Mp. Right column: fraction of planetesimals captured by the planet as a function of the source semi-major axis (the same as Fig. 4) for the different cases we consider as indicated in the legend. Cases shown with red (blue) plots in (d)-1 are shown with red (blue) lines in (d)-2. |
5 Discussion
5.1 Implications for planet formation
The total heavy-element mass in a gas-giant planet is a combination of the core mass and the heavy elements within the envelope. The core’s mass can be thought to be of the order of the critical core mass in the case of a proto-giant planet that forms in outer regions of a relatively massive disc as considered in this study. This is essentially the mass that is accreted during the first phase (phase-1) in the formation of a giant planet. The maximum heavy-element mass that can be accreted by a giant planet forming in situ by planetesimal accretion, assuming no planetesimals are accreted during runaway gas accretion, can be given by the isolation mass, Miso (Lissauer 1987; Kokubo & Ida 1998). From the empirical relation for Miso obtained by Kokubo & Ida (1998), Miso is 70–80 M⊕ at 20 AU for a solid surface density that is six times higher than the MMSN value. However, it should be considered that the critical core can be significantly smaller than the one inferred when assuming dust-rich protoplanetary envelopes (Ikoma et al. 2000, 2006), due to grain growth and settling which leads to reduction in opacity and shorter formation timescales (Ormel 2013; Mordasini 2014). In the latter case, the critical core mass is expected to be on the order of ~ 10 M⊕ or smaller. Even in the case of rapid pebble accretion, pebbles will vaporise in the planetary envelope and, therefore, significantly reduce the core mass (Hori & Ikoma 2011; Venturini et al. 2015; Brouwers et al. 2018). As a result, the core mass is unlikely to be much higher than 10 M⊕.
After the first phase, which is dominated by heavy-element accretion, the gas accretion rate becomes much higher than the heavy-element accretion rate. The dense gaseous envelope prevents planetesimals from reaching the core, and the planetesimals are expected to remain in the envelope. In fact, the division between the “core” and “envelope” is not always well-defined (Helled & Stevenson 2017; Lozovsky et al. 2017; Valletta & Helled 2019). After the onset of the runaway gas accretion, the rapidly expanding feeding zone permits the further accretion of planetesimals that are distributed around the planet. During that phase, up to 30% of the planetesimals inside the planet’s feeding zone can be accreted by the planet (Shibata & Ikoma 2019). As we show here, a higher mass of heavy elements can be captured when planetary migration is considered.
Using the same parameters as those adopted in our reference model, we find that the planet captures ~ 18 M⊕ of planetesimals (equivalent to 30% of all planetesimals inside the Jupiter-mass planet’s feeding zone at 20 AU) during the subsequent rapid gas accretion phase. Then, over the course of inward migration, the planet captures 20 M⊕ of planetesimals (see Sect. 3). Therefore, assuming that a warm-Jupiter that starts its formation at 20 AU, it captures ~40−50 M⊕ heavy elements by the end of its migration.
Figure 6 shows a histogram of the inferred heavy-element mass in warm-Jupiters based on the data presented in Thorngren et al. (2016). We divide the data into super-Saturns, assuming that these planets have experienced rapid gas accretion, while the sub-Saturns have not. The median of heavy-element mass inferred for these warm-Jupiters (red bars) is ~ 50 M⊕. This value is consistent with our results. Therefore, our study suggests that the metal-rich warm-Jupiters must have migrated inward fromafar to their current location. Our study provides an independent way to constrain the formation history of giant exoplanets at small orbits simply by estimating their bulk compositions. Our conclusion is in agreement with studies that imply a migration history for these planets based on their orbital parameters (e.g. Ida & Lin 2004). At the same time, our study emphasises the challenge for planet formation models to explain the highly enriched warm-Jupiters, which contain more than 100 M⊕ of heavy elements.
Our model can explain enrichment of up to ~100 M⊕ of heavy elements in warm-Jupiters. This is because the amount of heavy elements can be increased when faster planetary migration, larger planetesimals, longer migration lengths (see Fig. 5), or heavier circumstellar discs are considered. There are circumstellar discs up to 10–20 times more massive than the MMSN, according to observations of young stellar clusters (e.g. W Beckwith et al. 1996; Dullemond et al. 2018) and some of the central star in Thorngren et al. (2016)’s data have 1–2 times higher metallicity relative to our Sun. Nevertheless, even under these idealised assumptions, the super-enriched giant planets cannot be explained. Therefore, we suggest that any further enrichment is expected to be a result of other enrichment mechanisms, such as giant impacts and planet merging (Ikoma et al. 2006; Liu et al. 2015) or additional processes neglected in our model, as discussed below.
Our study suggests that the relation between the heavy-element mass Mp,Z and planet mass Mp found by Thorngren et al. (2016) is rather complex. We show that there is no simple relation between  and Mp (Fig. 5d-1). On theother hand,
  increases in an almost linear fashion with the initial position of the planet ap,int (Fig. 5c-1), suggesting that the formation of more enriched giant exoplanets starts at outer region of the disc. Therefore, our results predict that the relation between Mp,Z and Mp depends on the relation between the mass of gas giant planets and the position where runway gas accretion starts, which is consistent with the results of Tanigawa & Ikoma (2007) and Tanigawa & Tanaka (2016).
Recently, Humphries & Nayakshin (2018) considered giant planet formation via gravitational instability and accretion of pebbles during the rapid type 1 migration in order to reproduce the trends found by Thorngren et al. (2016). Their results imply that the planetary metallicity is increased by pebble accretion because rapid migration hinders gap opening in the pebble disc. Our model cannot be directly compared with this work because we focus on type 2 migration. Nevertheless, our results suggest that the gas giants migrating with the type 1 regime can also capture many heavy elements even in a disc in which the solid material is in the form of planetesimals. In fact, heavy-element enrichment of clumps formed by gravitational instability via planetesimal capture was also found to be efficient and to lead to enrichments of several tens M⊕, depending on the planetary formation location and disc properties (Helled & Schubert 2009). We suggest that future studies compare the different predictions for the heavy-element enrichment of gaseous planets while considering both planetesimal and pebble accretion, type 1 and type 2 migration, and formation via both core accretion and disk instability.
Finally, it should be noted that in terms of planetary bulk metallicity, migration is much more significant for the lower planetary masses; for instance, for a 0.5 MJ with an initial core mass of 10 M⊕, the total heavy-element mass can increase by a factor of four, resulting in a planetary metallicity of ~ 30%. Also, it is important to keep in mind that the inferred heavy-element masses of the giant exoplanets can vary depending on the model assumptions, in particular, the equation of state used for hydrogen and helium, the gas and dust opacity, the assumed compositions and thermal profile, etc. It is, therefore, desirable to investigate the sensitivity of the inferred planetary metallicity of warm/hot Jupiters in a more rigorous way and we hope to address this in future research.
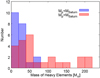 |
Fig. 6 Estimated heavy-element mass in warm-Jupiters. The histogram is constructed using the results obtained by Thorngren et al. (2016). Red and blue bars show the planets that are heavier than Saturn and lighter than Saturn, respectively. |
5.2 Resonant braking in planet-planetesimal resonance
Planetesimals escape from MMRs during planetary migration because strong aerodynamic gas drag amplifies the libration of resonance angle and the libration of semi-major axis exceeds the resonant width of MMRs (see Appendix C for details). This mechanism was named overstable libration in the context of planet-planet resonant breaking (Goldreich & Schlichting 2014; Hands & Alexander 2018). The main difference between their planet-planet resonant breaking and our planet-planetesimal resonant breaking is the source of damping. The planet’s orbit is damped by the gravitational interaction with the circumstellar disc, while the planetesimal’s orbit is damped by the aerodynamic interaction with circumstellar disc. We find that this “overstable libration” occurs even in planet-planetesimal resonance because the planetesimal’s eccentricity reaches a very high value (~ 0.1) leading to the damping timescale of the eccentricity becoming shorter than that of the planetary migration, which is a requirement of this resonant breaking. Our results show that overstable libration plays an important role in planetesimal accretion. Adetailed analysis of planet-planetesimal resonant breaking is desirable but it is beyond the scope of this paper and we hope to address it in future research.
The results of our parameter study regarding planetary mass (see Fig. 5) might be important for understanding the planet-planetesimal resonance and its resonant breaking. This unique relation between heavy-element mass and planet mass can be observable, assuming there are no other effects that lead to the non-monotonic relation between them. The planetary mass-enrichment dependency derived in this study is not found in the sample of Thorngren et al. (2016), however, this could be a result of limited data. As a result, we suggest that further observations could be used to better understand the role of planet-planetesimal resonance in the capture of planetesimals by a migrating planet.
5.3 Effects neglected in this work
In this study, we considered only one migrating planet. Also, we treated the planetesimals as test particles and ignored the effects of their mutual collisions and gravitational forces on the migrating planet. The effects of the accreted solids on the planetary evolution (via changesin composition and opacity) were also neglected. In addition, we used Eq. (16), assuming a constant mean density ρp = 0.125 g cm−3 for the planet’s radius, although the planetary capture radius can differ from this value (e.g. Podolak et al. 1988; Inaba & Ikoma 2003). We discuss below the potential effects of these processes on our results.
When a gas giant planet starts to migrate, many other planets may exist within the orbit of the gas giant in the same system. If the relative distance between the gas giant planet and other planets decreases due to their different migration timescales (converging process), the planets ahead of the gas giant planet could scatter planetesimals into the giant planet’s feeding zone, reducing the efficiency of aerodynamic shepherding. In addition, the gravitational perturbation from those planets upon planetesimals trapped in MMRs would amplify the libration of their orbits, thereby breaking the resonant shepherding process. Thus, in the converging processes, the existence of other planets is expected to enhance the efficiency of capture of planetesimals by the migrating giant planet. On the other hand, if the relative distance increases (diverging process), planetesimals would be swept up by those planets, reducing the heavy-element mass accretion efficiency. These effects should be investigated in future research.
During the migration process, the surface density of planetesimals around MMRs increases. The timescale of collision between the planetesimals becomes shorter with increasing surface density. The collision between planetesimals results in two opposite effects on the planetesimal capture efficiency. First, collisions perturb the planetesimals’ orbits and some of the collisions can eject planetesimals from resonant trapping. Malhotra (1993) investigated this effect and found that the velocity and direction of collision determines whether the resonant trapping is broken. This effect increases the efficiency of planetesimal capture by a migrating giant planet. Second, collisions between highly eccentric planetesimals lead to shattering, which produces many small fragments. This effect reduces the planetesimal capture efficiency because small-size planetesimals are easily shepherded by a migrating planet (see: Fig. 5). Thus, collisions between planetesimals have the effect of increasing and decreasing the heavy-element enrichment of a migrating giant planet; the net effect is the subject of our future investigation.
Due to the shepherding processes, many planetesimals are pushed inward by a migrating planet. At the same time, these planetesimals push the migrating planet in the opposite direction; this effect is neglected in our model. The maximum amount of planetesimals being shepherded by the migrating planet is ~ 50 M⊕ in the reference model, which corresponds to ~20% of the mass of the migrating planet. Due to the exchange of torques, the migration timescale would be prolonged by ~ 20% (Ida & Lin 2004). Therefore, such an effect slows down the migration speed of the planet.
After gas accretion terminates, giant planets contract gradually. The high accretion rate of heavy-elements, however, affects the planetary evolution due to the change in the planetary composition, thermal energy, and opacity. While the accreted heavy-elements can lead to an expansion of the radius due to the additional energy and increased (gas+dust) opacity, it can also decrease the radius due to the addition of heavy elements. There is also a possibility that the high heavy-element accretion rate would results in an increase in luminosity which, in return, may decelerate the planetary contraction. The expansion of the planet radius results in the enhancement of capture radius and the enhancement of capture rate of planetesimals. The feedback effect occurs between the capture of planetesimals and the planet radius. It is, therefore, desirable to perform a calculation of the planetary evolution that takes into account the migration and heavy-element accretion self-consistently. We hope to address this in future research.
6 Summary
A significant number of the warm-Jupiters with measured masses and radii are thought to be metal-rich relative to their host stars. Moderate heavy-element enrichment can be explained by planetesimal capture in the late-formation stages of gas giant planets. In this study, we performed numerical simulations of the dynamics of planetesimals around a migrating giant planet, taking into account the effects of mean motion resonances, and we investigated the fundamental physics for planetesimal capture during planetary migration. We then investigated the total amount of planetesimals that the giant planet finally captures for several model parameters, including the migration timescale, the size of planetesimals, the migration length, and the planetary mass. Our main findings can be summarised as follows:
(1) There are two shepherding processes (resonant shepherding and aerodynamic shepherding) that act as barriers for planetesimal capture by a migrating gas giant planet. (2) Aerodynamic gas drag has two key effects that lead to the breaking of the resonantshepherding and, on the other hand, that cause aerodynamic shepherding. (3) Planetesimal capture occurs when both shepherding processes are ineffective. (4) A migrating Jupiter-mass planet can capture planetesimals with total mass of a few tens of Earth masses, provided it starts migration at a few tens of AU in a relatively massive planetesimal disc. (5) The planetesimal capture efficiency peaks at the moderate migration timescale τtid,0 = 104.5 yr. (6) A migratingplanet captures larger planetesimals more efficiently. (7) The captured heavy-element mass increases with the migration length almost linearly. (8) The planetesimal capture efficiency depends on the position of MMRs relative to the feeding zone boundary.
We conclude that planetary migration increases planetary metallicity. We suggest that the heavy elements in warm- and hot-Jupiters are mainly delivered by planetesimal accretion during planetary migration and that the relation between the heavy-element mass and planetary mass could be explained by different migration distances. Clearly, our work does not include all the governing physical processes and there is much more work to be done in the future, including the consideration of effects caused by the existence of other planets, collision among planetesimals, pebble accretion, and changes in the internal structure of the gas-giant planet. Therefore, our study should be considered a first step in a detailed investigation of the enrichment mechanisms of gas-giant planets. This will lead to a better understanding of the gas giants in the solar system and of giant exoplanets.
Acknowledgements
We thank the referee for the valuable comments. This work is supported by JSPS Core-to-Core Program “International Network of Planetary Sciences (Planet2)” and JSPS KAKENHI Grant Numbers 17H01153 and 18H05439. R.H. acknowledges support from SNSF grant 200021_169054. Some of this work has been carried out within the framework of the National Centre for Competence in Research PlanetS, supported by the Swiss National Foundation. Numerical computations were carried out on the Cray XC50 at the Center for Computational Astrophysics, National Astronomical Observatory of Japan.
Appendix A Drag coefficient
In general, the non-dimensional drag coefficient Cd is a function of the Reynolds number  (=2ρgasRplu∕μ; vpl being velocity of planetesimals and μ being dynamic viscosity) and the Mach number
  (=vpl∕cs; cs being the sound speed). The dynamic viscosity is given by μ = (1∕3)ρgascslm, where lm is the mean free path of gas molecules for which we adopt the collision cross section of hydrogen molecules (=2 × 10⁻¹⁵ cm2). In this study, we use an approximated formulae for Cd written as (e.g. Tanigawa et al. 2014)
![Mathematical equation: \begin{align*}C_{\textrm{d}} \simeq \left[ \left( \frac{24}{\mathcal{R}} + \frac{40}{10+\mathcal{R}} \right)^{-1} + \frac{3 \mathcal{M}}{8} \right]^{-1} + \frac{ (2-\omega_{\textrm{crr}}) \mathcal{M}}{1+\mathcal{M}} + \omega_{\textrm{crr}}, \end{align*}](/articles/aa/full_html/2020/01/aa36700-19/aa36700-19-eq40.png) (A.1)
(A.1)
where ωcrr is a correction factor, the value of which is 0.4 for  and 0.2 for
  .
.
Appendix B Gap structure in a circumstellar disc
Kanagawa et al. (2017) derived an empirical formulae for the gas structure based on the results of hydrodynamic simulations. They found that there is a relation between the gap width Δgap and non-dimensional parameter K′ as
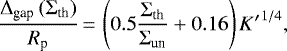 (B.1)
(B.1)
where Σth and Σun are the surface density of disc gas inside the gap and outside the gap, respectively, and K′ is a non-dimensional parameter defined as
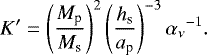 (B.2)
(B.2)
They also found the surface density at the gap bottom as
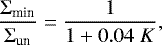 (B.3)
(B.3)
where K is the non-dimensional parameter defined as
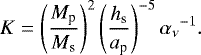 (B.4)
(B.4)
Using the results above, they constructed an empirical function representing the radial distribution of the gap structure fgap as
![Mathematical equation: \begin{align*}f_{\textrm{gap}} = \left\{ \begin{array}{ll} \frac{1}{1+ 0.04\; K} & \text{for $| r - a_{\textrm{p}} | < R_{\textrm{1}}$}, \\[5pt] 4.0 \;{K^{\prime}}^{-1/4} \frac{|r-a_{\textrm{p}} |}{a_{\textrm{p}} } -0.32 & \text{for $R_{\textrm{1}} < | r - a_{\textrm{p}} | < R_{\textrm{2}}$}, \\[5pt] 1 & \text{for $R_{\textrm{2}} < | r - a_{\textrm{p}} |$}, \end{array} \right. \end{align*}](/articles/aa/full_html/2020/01/aa36700-19/aa36700-19-eq47.png) (B.5)
(B.5)
where

Appendix C Detailed analysis of shepherding processes
In Sect. 3, we discuss how two shepherding processes play important roles in the process of planetesimal capture by the migrating planet. In this section, we analyse those shepherding processes and their influence on the efficiency of the planetesimal capture in detail.
C.1 Resonant shepherding
First, the resonant trapping requires the following conditions:
- (i)
the eccentricity of the planetesimal on the approach to resonance is smaller than a critical one ecrit,
- (ii)
the libration width of the planetesimal orbit is smaller than the resonance width.
The critical eccentricity for the (p+q):p MMR is given by (e.g. Murray & Dermott 1999)
 (C.1)
(C.1)
where ζp,q is the interaction coefficient, the values of which are − 1.19, − 2.02, and 3.27 for the 2:1, 3:2, and 5:3 MMRs. In the reference case, ecrit = 0.15, 0.12 and 0.11 for the 2:1, 3:2, and 5:3 MMRs, respectively. The resonance width is given in the terms of the semi-major axis as (e.g. Murray & Dermott 1999)
 (C.2)
(C.2)
where ac is the semi-major axis of the resonance’s centre, which are 0.063e1∕2, 0.091e1∕2, and 0.11e1∕2 for the 2:1, 3:2 and 5:3 MMRs, respectively.
The motion of test particles trapped in the (p+q):q MMR is known to have an adiabatic invariant given by (Yu & Tremaine 2001)
 (C.3)
(C.3)
provided the particles are exerted on by no non-conservative force such as gas drag. By taking the time derivative of Eq. (C.3), one obtains the excitation rate of the eccentricity as
 (C.4)
(C.4)
for i = 0. During resonant trapping, the planetesimal’s eccentricity is excited by the planet’s gravitational scattering and damped by the aerodynamic gas drag. The equation above indicates that the excitation rate decreases with increasing eccentricity, while the damping rate increases with increasing eccentricity (Adachi et al. 1976). As a result, the eccentricity of planetesimals takes an equilibrium value during the resonant trapping.
Whether a test particle is trapped in a MMR is often checked by use of the resonance angle defined as
 (C.5)
(C.5)
where λp and λ are the mean longitude of the planet and the planetesimal, respectively, and ϖ is the longitude of pericentre of the planetesimal. While circulating rapidly outside MMRs, the resonance angle librates inside MMRs.
Figure C.1 shows the orbital evolution of a planetesimal initially located at 14.3 AU. In panel a, the evolutionary path of the planetesimalis shown on the  plane, where
 (C.6)
(C.6)
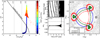 |
Fig. C.1 Orbital evolution of a single planetesimal initially located at the semi-major axis ap,0 = 14.3 AU. Panel a: the evolutionary path of the planetesimal in the plane whose vertical and horizontal axes are the eccentricity, e, and the difference in semi-major axis between the planetesimal, a and planet, ap, respectively;both are normalised by the reduced Hill radius, h (see Eq. (20)). The time sequence is colour-coded. Dashed line indicates the boundary of the feeding zone. Dotted lines are eye-guide ones that show the resonance centre of the 2:1, 5:3 and 3:2 mean motion resonances (MMRs) with the planet, from left to right. Panels b and c: the temporal changes in the resonance angle (see Eq. (C.5)) and in the semi-major axis of the planetesimal normalised by that of the resonance centre, ac (see Eq. (C.2)), respectively, for the 3:2 MMR. The dotted lines indicate the resonant width of the 3:2 MMR. Panel d: the orbits of the planetesimal on the co-rotating flame with themigrating planet. Blue, green and red dots show the path of the planetesimal for e = 0, 0.2 and 0.4, respectively.The gray dots show the orbit of the planetesimal after escaping from the resonance. The black circle shows the Hill sphere of the planet. |
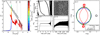 |
Fig. C.2 Orbital evolution of a single planetesimal initially located at apl,0 = 10.0 AU. Panel a: the same as Fig. C.1a, but for apl,0 = 10.0 AU. Panels b and c and d and e: the temporal changes in the resonance angle (see Eq. (C.5)) and in the planetesimal’s semi-major axis relative to the resonance centre, ac (Eq. (C.2)), respectively, in the 2:1 and 3:2 mean motion resonances (MMRs) with the planet. Panel f: the same as Fig. C.1d, but for the planetesimal with e = 0, 0.1, and 0.5 in the 2:1 MMR. See the caption of Fig. C.1 for details. |
On this plane, the boundary of the feeding zone (dashed line) and the locations of the resonance centres (dotted lines) are fixed in our model. At the beginning of the simulation, the planetesimal is in between the 5:3 and 3:2 MMRs. As the planet migrates inward, the planetesimal is trapped in the 3:2 MMR, its eccentricity becomes highly excited, and then enters the feeding zone. The eccentricity keeps increasing until it reaches the equilibrium value mentioned above (ẽ ~ 7.0).
In panels b and c, the resonance angle (Eq. (C.5)) and the planetesimal’s semi-major axis relative to the resonance centre ac are shown over time. In panel c, the resonance width given by Eq. (C.2) is also shown with the dotted lines; its eccentricity is substituted from the simulation’s result. When t ≲ 4 × 10⁵ yr, the resonance angle circulates relatively slowly from 0 to 2π (Fig. C.1b) and the libration width is much smaller than the resonance width (Fig. C.1c). After the eccentricity reaches the equilibrium value, however, the libration is amplified due to the strong aerodynamic gas drag. Once the libration width exceeds the resonance width, the resonance angle starts to circulate rapidly, breaking the resonant trapping.
Panel d shows the planetesimal’s orbits on the co-rotating frame with the migrating planet before (red, green, and blue dots) and after (gray dots) escaping from the 3:2 MMR. It turns out that during the resonant trapping, the planetesimal never enters the planet’s Hill sphere (indicated by a black line) even inside the feeding zone. Once it has escaped from the resonance, however, the planetesimal experiences many close encounters with the planet and ends up being captured by the planet or eliminated from its feeding zone.
The orbital evolution of a planetesimal initially located somewhat closer to the central star is shown in Fig. C.2, which is the same as Fig. C.1 but for a0 = 10 AU. As shown in Fig. C.2a, in contrast to the case shown in Fig. C.1a, the planetesimal once enters the feeding zone, but then gets out of the feeding zone through the 2:1 MMR. This is because the transport of the resonantly-trapped planetesimal to inner high-density region leads to a lowering of the equilibrium eccentricity to below the eccentricity corresponding to the feeding zone boundary before the resonant trapping is broken. After escaping from the 2:1 resonant trapping with ẽ ~ 4, the planetesimal undergoes other resonant trappings. Panels b and c and d and e show the resonance angle and semi-major axis (relative to the resonance centre) of the planetesimal in the 2:1 and 3:2 MMRs, respectively. We find that the planetesimal escaping from the 2:1 resonant trapping is trapped in the 3:2 MMR. After staying in the 3:2 MMR for a while, the planetesimal ends up entering the feeding zone. Because of the same reason as the 3:2 resonant trapping (Fig. C.1d), the planetesimal never enters the Hill sphere during being trapped in the 2:1 MMR, as shown in panel f.
C.2 Aerodynamic shepherding
Inward migration of the planet (or a decrease in distance between the planet and planetesimal) leads to an increase in the Jacobi energy of the planetesimal orbiting interior to the planet’s orbit, whereas the aerodynamic gas drag reduces it. As the planet migrates inward, the timescale of migration slowly decreases ( ; see Eq. (5)), while that of damping by aerodynamic gas drag decreases even faster because the disc gas density depends on a more strongly than a1∕2. In the reference model, the latter overwhelms the former at ap ≲ 2 AU. Indeed, in the case of Fig. C.3, which shows the evolution path of a planetesimal initially located at 5.0 AU; for example, the aerodynamic gas drag is so strong when the planetesimal reaches the feeding zone boundary (the planet orbiting at 3 AU) that the aerodynamic shepherding inhibits the planetesimal from entering the feeding zone.
C.3 Effects of resonant and aerodynamic shepherding processes on the capture of planetesimals
Using the analysis of the resonant shepherding and aerodynamic shepherding presented above, we re-analysed the results presented in Sect. 3.
Figure C.4 shows the temporal changes in (a) the planetesimal capture rate and (b) the total mass of planetesimals inside the planet’s feeding zone. The red and blue lines show the contributions of planetesimals initially located on the side far from and close to the central star relative to the initial position of the 2:1 MMR with the planet (12.6 AU), respectively;the black line shows the sum of both contributions. As can be seen from Figs. 3a and b, it is found that the planetesimal capture rate correlates with the total mass of planetesimals inside the feeding zone for t ≳ 4 × 10⁵ yr, but this dependence is not observed for t < 4 × 10⁵ yr. We also find that the total mass of planetesimals inside the feeding zone rapidly increases around t ~ 1 × 10⁵ yr and suddenly decreases at t ~ 3 × 10⁵ yr. These features are related with the resonant shepherding by the 2:1 and 3:2 MMRs.
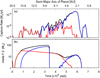 |
Fig. C.4 Temporal changes in (a) the capture rate of planetesimals and (b) the total mass of planetesimals inside the feeding zonein the reference case (see Table 1 for the setting). Red and blue lines show the contributions of planetesimals initially located on the side far from and close to the central star relative to the initial position of the 2:1 mean motion resonance (12.6 AU), respectively; the black one shows all the contributions. Top x-axis shows the semi-major axis of the migrating planet. |
The rapid increase of total planetesimal mass inside the feeding zone is brought by the resonant shepherdingas shown in Figs. C.1a and C.2a. As the planet migrates inward, the equilibrium eccentricity at the 2:1 MMR, which was initially inside the feeding zone in the  –ẽ plane, becomes smaller than the eccentricity corresponding to the feeding zone boundary. Then, the total mass of planetesimals inside the feeding zone suddenly decreases at t ~ 3 × 10⁵ yr. When t < 4 × 10⁵ yr, planetesimals inside the feeding zone are trapped in the 2:1 or 3:2 MMRs and on “out-of-phase” librating orbits that never approach the planet’s Hill sphere (see Figs. C.1d and C.2f), thus, the planetesimal capture rate is low despite the large number of planetesimals within the feeding zone.
As explained in Appendix C.1, the planetesimals start to escape from the resonant traps at t ~ 4 × 10⁵ yr; some of the planetesimals that were in the 3:2 MMR from early on are captured by the planet (the red line in Fig. 3) and some of the planetesimals escaping from the 2:1 MMR enter the feeding zone through the 3:2 MMR (the blue line), which further increases the total mass of planetesimals inside the planet’s feeding zone until t ~ 6 × 10⁵ yr. Finally, the aerodynamic shepherding hinders planetesimals from entering the planet’s feeding zone. By the time the planet reaches ~ 1 AU, almost all the planetesimals are eliminated from the feeding zone because of the aerodynamic shepherding. Our analysis demonstrates that the resonant shepherding delays the main accretion phase until the planet reaches ~ 6 AU, and the aerodynamic shepherding stops planetesimal accretion when the planet reaches ~ 1 AU.
Appendix D Channel of planetesimal flow into planetary feeding zone
Figure D.1 shows the total mass of planetesimals that enter the feeding zone vs.  at the time of entry. The positions of 1st-order MMRs such as 2:1 and 3:2 and 2nd-order MMRs such as 3:1 and 5:3 are indicated by the red and blue dotted lines, respectively. The ẽ –
 relationship for the feeding zone boundary is shown by the black solid line.
Also, we highlight MMRs that do not contribute to the enrichment of the planet with heavy elements. Planetesimals that enter the feeding zone via these MMRs are not captured by the planet. This is because the strongly trapped planetesimals leave the feeding zone through the same MMR, as shown in Fig. C.2.
First, we find that a large fraction of planetesimals enter the feeding zone through the 1st-order MMRs. Thus, in the cases of Mp = 0.7 MJ and 1.4 MJ, the 3:2 MMR is the main channel into the feeding zone. When the planetary mass is larger than 1.4 MJ, the 3:2 MMR is engulfed by the feeding zone and only a small amount of planetesimals enter the feeding zone through the 5:3 MMR, which results in the decrease in  . Finally, in the case of Mp = 5.7 MJ, the 2:1 MMR is located at
  and the equilibrium eccentricity becomes larger than the eccentricity corresponding to the feeding zone boundary. As a result, the 2:1 MMR becomes the main channel for supplying planetesimals into the feeding zone and for planetary enrichment.
In comparing the cases of Mp = 0.7 MJ and 1.4 MJ, we find that the total mass of planetesimals entering the feeding zone is larger in the former case (~ 74 M⊕) than in the latter (~ 66 M⊕); nevertheless, the total mass of captured planetesimals is larger in the latter case. As shown in Fig. D.1, the 1st-order MMR (i.e. 3:2 MMR) is located at for Mp = 0.7 MJ and
  for Mp = 1.4 MJ. An increase in
  corresponds to that in ẽ at the feeding zone boundary, which results in a decrease in the planetesimal capture probability. In summary,
  for Mp = 1.4 MJ is larger than that of Mp = 0.7 MJ because the 1st-order MMR (i.e. 3:2 MMR) is closer to the planet in the former case.
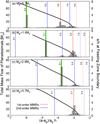 |
Fig. D.1 Total mass of planetesimals that enter the feeding zone (or the total mass flow of planetesimals) as a function of their location relative the planet at the time of entry,
|
References
- Adachi, I., Hayashi, C., & Nakazawa, K. 1976, Prog. Theor. Phys., 56, 1756 [NASA ADS] [CrossRef] [Google Scholar]
- Alibert, Y., Mordasini, C., Benz, W., & Winisdoerffer, C. 2005, A&A, 434, 343 [NASA ADS] [CrossRef] [EDP Sciences] [Google Scholar]
- Alibert, Y., Venturini, J., Helled, R., et al. 2018, Nat. Astron., 2, 873 [NASA ADS] [CrossRef] [Google Scholar]
- Batygin, K., & Laughlin, G. 2015, Proc. Natl. Acad. Sci. U.S.A., 112, 4214 [NASA ADS] [CrossRef] [Google Scholar]
- Bitsch, B., Izidoro, A., Johansen, A., et al. 2019, A&A, 623, A88 [NASA ADS] [CrossRef] [EDP Sciences] [Google Scholar]
- Booth, R. A., Clarke, C. J., Madhusudhan, N., & Ilee, J. D. 2017, MNRAS, 469, 3994 [NASA ADS] [CrossRef] [Google Scholar]
- Brouwers, M. G., Vazan, A., & Ormel, C. W. 2018, A&A, 611, A65 [NASA ADS] [CrossRef] [EDP Sciences] [Google Scholar]
- Dullemond, C. P., Birnstiel, T., Huang, J., et al. 2018, ApJ, 869, L46 [NASA ADS] [CrossRef] [EDP Sciences] [Google Scholar]
- Goldreich, P., & Schlichting, H. E. 2014, AJ, 147, 32 [NASA ADS] [CrossRef] [Google Scholar]
- Guillot, T., Santos, N. C., Pont, F., et al. 2006, A&A, 453, L21 [NASA ADS] [CrossRef] [EDP Sciences] [Google Scholar]
- Hands, T. O., & Alexander, R. D. 2018, MNRAS, 474, 3998 [NASA ADS] [CrossRef] [Google Scholar]
- Hasegawa, Y., Bryden, G., Ikoma, M., Vasisht, G., & Swain, M. 2018, ApJ, 865, 32 [NASA ADS] [CrossRef] [Google Scholar]
- Hayashi, C. 1981, Prog. Theor. Phys. Suppl., 70, 35 [NASA ADS] [CrossRef] [MathSciNet] [Google Scholar]
- Hayashi, C., Nakazawa, K., & Adachi, I. 1977, PASJ, 29, 163 [NASA ADS] [Google Scholar]
- Helled, R., & Schubert, G. 2009, ApJ, 697, 1256 [NASA ADS] [CrossRef] [Google Scholar]
- Helled, R., & Stevenson, D. 2017, ApJ, 840, L4 [NASA ADS] [CrossRef] [Google Scholar]
- Hori, Y., & Ikoma, M. 2011, MNRAS, 416, 1419 [NASA ADS] [CrossRef] [Google Scholar]
- Humphries, R. J., & Nayakshin, S. 2018, MNRAS, 477, 593 [NASA ADS] [CrossRef] [Google Scholar]
- Ida, S., & Lin, D. N. C. 2004, ApJ, 604, 388 [NASA ADS] [CrossRef] [PubMed] [Google Scholar]
- Ida, S., & Nakazawa, K. 1989, A&A, 224, 303 [NASA ADS] [Google Scholar]
- Ikoma, M., Nakazawa, K., & Emori, H. 2000, ApJ, 537, 1013 [NASA ADS] [CrossRef] [Google Scholar]
- Ikoma, M., Guillot, T., Genda, H., Tanigawa, T., & Ida, S. 2006, ApJ, 650, 1150 [NASA ADS] [CrossRef] [MathSciNet] [Google Scholar]
- Inaba, S., & Ikoma, M. 2003, A&A, 410, 711 [NASA ADS] [CrossRef] [EDP Sciences] [Google Scholar]
- Johansen, A., Low, M. M. M., Lacerda, P., & Bizzarro, M. 2015, Sci. Adv., 1, 1500109 [NASA ADS] [CrossRef] [Google Scholar]
- Kanagawa, K. D., Tanaka, H., Muto, T., & Tanigawa, T. 2017, pasj, 69, 97 [NASA ADS] [CrossRef] [Google Scholar]
- Kokubo, E., & Ida, S. 1998, Icarus, 131, 171 [NASA ADS] [CrossRef] [Google Scholar]
- Lambrechts, M., Johansen, A., & Morbidelli, A. 2014, A&A, 572, A35 [NASA ADS] [CrossRef] [EDP Sciences] [Google Scholar]
- Lissauer, J. J. 1987, Icarus, 69, 249 [NASA ADS] [CrossRef] [Google Scholar]
- Liu, S.-F., Agnor, C. B., Lin, D. N. C., & Li, S.-L. 2015, MNRAS, 446, 1685 [NASA ADS] [CrossRef] [Google Scholar]
- Lozovsky, M., Helled, R., Rosenberg, E. D., & Bodenheimer, P. 2017, ApJ, 836, 227 [NASA ADS] [CrossRef] [Google Scholar]
- Lynden-Bell, D., & Pringle, J. E. 1974, MNRAS, 168, 603 [NASA ADS] [CrossRef] [Google Scholar]
- Malhotra, R. 1993, Icarus, 106, 264 [NASA ADS] [CrossRef] [Google Scholar]
- Miller, N., & Fortney, J. J. 2011, ApJ, 736, L29 [NASA ADS] [CrossRef] [Google Scholar]
- Morbidelli, A., Bottke, W. F., Nesvorný, D., & Levison, H. F. 2009, Icarus, 204, 558 [NASA ADS] [CrossRef] [Google Scholar]
- Mordasini, C. 2014, A&A, 572, A118 [NASA ADS] [CrossRef] [EDP Sciences] [Google Scholar]
- Murray, C. D., & Dermott, S. F. 1999, Solar System Dynamics (Cambridge: Cambridge University Press,) [Google Scholar]
- Ormel, C. W. 2013, MNRAS, 428, 3526 [NASA ADS] [CrossRef] [Google Scholar]
- Podolak, M., Pollack, J. B., & Reynolds, R. T. 1988, Icarus, 73, 163 [NASA ADS] [CrossRef] [Google Scholar]
- Pollack, J. B., Hubickyj, O., Bodenheimer, P., et al. 1996, Icarus, 124, 62 [NASA ADS] [CrossRef] [Google Scholar]
- Shakura, N. I., & Sunyaev, R. A. 1973, A&A, 24, 337 [NASA ADS] [Google Scholar]
- Shibata, S., & Ikoma, M. 2019, MNRAS, 487, 4510 [NASA ADS] [CrossRef] [Google Scholar]
- Shiraishi, M., & Ida, S. 2008, ApJ, 684, 1416 [NASA ADS] [CrossRef] [Google Scholar]
- Tanaka, H., & Ida, S. 1999, Icarus, 139, 350 [NASA ADS] [CrossRef] [Google Scholar]
- Tanigawa, T., & Ikoma, M. 2007, ApJ, 667, 557 [NASA ADS] [CrossRef] [Google Scholar]
- Tanigawa, T., & Tanaka, H. 2016, ApJ, 823, 48 [NASA ADS] [CrossRef] [Google Scholar]
- Tanigawa, T., Maruta, A., & Machida, M. N. 2014, ApJ, 784, 109 [NASA ADS] [CrossRef] [Google Scholar]
- Thorngren, D.P., Fortney, J. J., Murray-Clay, R. A., & Lopez, E. D. 2016, ApJ, 831, 64 [NASA ADS] [CrossRef] [Google Scholar]
- Valletta, C., & Helled, R. 2019, ApJ, 871, 127 [NASA ADS] [CrossRef] [Google Scholar]
- Venturini, J., Alibert, Y., Benz, W., & Ikoma, M. 2015, A&A, 576, A114 [NASA ADS] [CrossRef] [EDP Sciences] [Google Scholar]
- W Beckwith, S. V., & Sargent, A. I. 1996, Circumstellar disks and the search for neighbouring planetary systems e. 0 4fi, Tech. rep. [Google Scholar]
- Yu, Q., & Tremaine, S. 2001, AJ, 121, 1736 [NASA ADS] [CrossRef] [Google Scholar]
- Zhou, J.-L., & Lin, D. N. C. 2007, ApJ, 666, 447 [NASA ADS] [CrossRef] [Google Scholar]
All Tables
All Figures
|
Fig. 1 Example of the disc’s surface density during planetary migration with t0 = 3 × 10⁶ yr. The disc’s surface density is shown as a function of distance from the central star. Solid lines show the radial profiles with gap opening for different locations of the planet as indicated in the legend. Black-dotted line shows the surface density of disc gas for t0 = 0. |
| In the text | |
|
Fig. 2 Snapshots of the orbital evolution of planetesimals for (a) t = 127 323 yr, (b) 397 887 yr, and (c) 572 957 yr in the reference case (see Table 1 for the setting). Horizontal and vertical axes are the semi-major axis and eccentricity, respectively. Red and blue circles indicate the planetesimals with positive and negative Jacobi energy, respectively; orange circle represents the migrating planet. Green dotted lines indicate the positions of 2:1, 5:3, and 3:2 mean motion resonances with the planet. |
| In the text | |
|
Fig. 3 Temporal changes in the cumulative mass of captured planetesimals in the reference case (see Table 1 for the setting). Top x-axis shows the semi-major axis of the migrating planet. |
| In the text | |
|
Fig. 4 Fraction of planetesimals captured by the planet versus their source semi-major axis for the reference case. Green, white, and turquoise areas correspond to the first, second, and third regions, respectively, denoted in Sect. 3.2. The difference between these regions is due to the different nature of the dominant shepherding process. Gray area shows the initial planetary feeding zone for planetesimals in circular orbits (e = 0). Dotted lines indicate the positions of the 2:1, 5:3, and 3:2 MMRwith the planet at the beginning of the simulation. The bin width of the histogram is 1∕3 AU. |
| In the text | |
|
Fig. 5 Results of the parameter study. Left column: total mass of captured planetesimals as a function of (a)-1: the migration timescale of the planet, τtid,0, (b)-1: the radius of planetesimals, Rpl, (c)-1: the initial semi-major axis of the planet ap,int, and (d)-1: the mass of the planet Mp. Right column: fraction of planetesimals captured by the planet as a function of the source semi-major axis (the same as Fig. 4) for the different cases we consider as indicated in the legend. Cases shown with red (blue) plots in (d)-1 are shown with red (blue) lines in (d)-2. |
| In the text | |
|
Fig. 6 Estimated heavy-element mass in warm-Jupiters. The histogram is constructed using the results obtained by Thorngren et al. (2016). Red and blue bars show the planets that are heavier than Saturn and lighter than Saturn, respectively. |
| In the text | |
|
Fig. C.1 Orbital evolution of a single planetesimal initially located at the semi-major axis ap,0 = 14.3 AU. Panel a: the evolutionary path of the planetesimal in the plane whose vertical and horizontal axes are the eccentricity, e, and the difference in semi-major axis between the planetesimal, a and planet, ap, respectively;both are normalised by the reduced Hill radius, h (see Eq. (20)). The time sequence is colour-coded. Dashed line indicates the boundary of the feeding zone. Dotted lines are eye-guide ones that show the resonance centre of the 2:1, 5:3 and 3:2 mean motion resonances (MMRs) with the planet, from left to right. Panels b and c: the temporal changes in the resonance angle (see Eq. (C.5)) and in the semi-major axis of the planetesimal normalised by that of the resonance centre, ac (see Eq. (C.2)), respectively, for the 3:2 MMR. The dotted lines indicate the resonant width of the 3:2 MMR. Panel d: the orbits of the planetesimal on the co-rotating flame with themigrating planet. Blue, green and red dots show the path of the planetesimal for e = 0, 0.2 and 0.4, respectively.The gray dots show the orbit of the planetesimal after escaping from the resonance. The black circle shows the Hill sphere of the planet. |
| In the text | |
|
Fig. C.2 Orbital evolution of a single planetesimal initially located at apl,0 = 10.0 AU. Panel a: the same as Fig. C.1a, but for apl,0 = 10.0 AU. Panels b and c and d and e: the temporal changes in the resonance angle (see Eq. (C.5)) and in the planetesimal’s semi-major axis relative to the resonance centre, ac (Eq. (C.2)), respectively, in the 2:1 and 3:2 mean motion resonances (MMRs) with the planet. Panel f: the same as Fig. C.1d, but for the planetesimal with e = 0, 0.1, and 0.5 in the 2:1 MMR. See the caption of Fig. C.1 for details. |
| In the text | |
 |
Fig. C.3 Same as Fig. C.1a, but for a0 = 5.0 AU. |
| In the text | |
|
Fig. C.4 Temporal changes in (a) the capture rate of planetesimals and (b) the total mass of planetesimals inside the feeding zonein the reference case (see Table 1 for the setting). Red and blue lines show the contributions of planetesimals initially located on the side far from and close to the central star relative to the initial position of the 2:1 mean motion resonance (12.6 AU), respectively; the black one shows all the contributions. Top x-axis shows the semi-major axis of the migrating planet. |
| In the text | |
|
Fig. D.1 Total mass of planetesimals that enter the feeding zone (or the total mass flow of planetesimals) as a function of their location relative the planet at the time of entry,
|
| In the text | |
Current usage metrics show cumulative count of Article Views (full-text article views including HTML views, PDF and ePub downloads, according to the available data) and Abstracts Views on Vision4Press platform.
Data correspond to usage on the plateform after 2015. The current usage metrics is available 48-96 hours after online publication and is updated daily on week days.
Initial download of the metrics may take a while.