Fig. 1
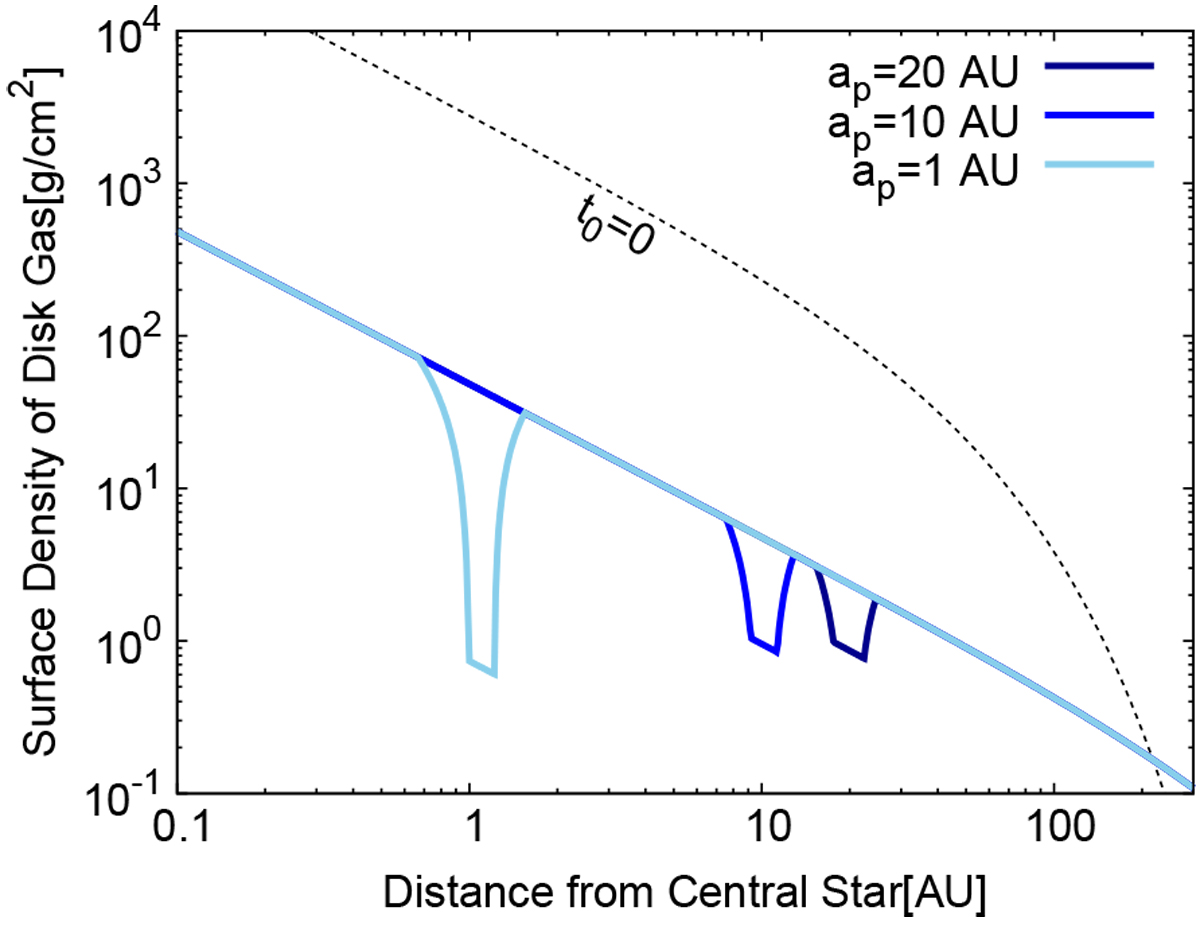
Example of the disc’s surface density during planetary migration with t0 = 3 × 10⁶ yr. The disc’s surface density is shown as a function of distance from the central star. Solid lines show the radial profiles with gap opening for different locations of the planet as indicated in the legend. Black-dotted line shows the surface density of disc gas for t0 = 0.
Current usage metrics show cumulative count of Article Views (full-text article views including HTML views, PDF and ePub downloads, according to the available data) and Abstracts Views on Vision4Press platform.
Data correspond to usage on the plateform after 2015. The current usage metrics is available 48-96 hours after online publication and is updated daily on week days.
Initial download of the metrics may take a while.