Fig. 4
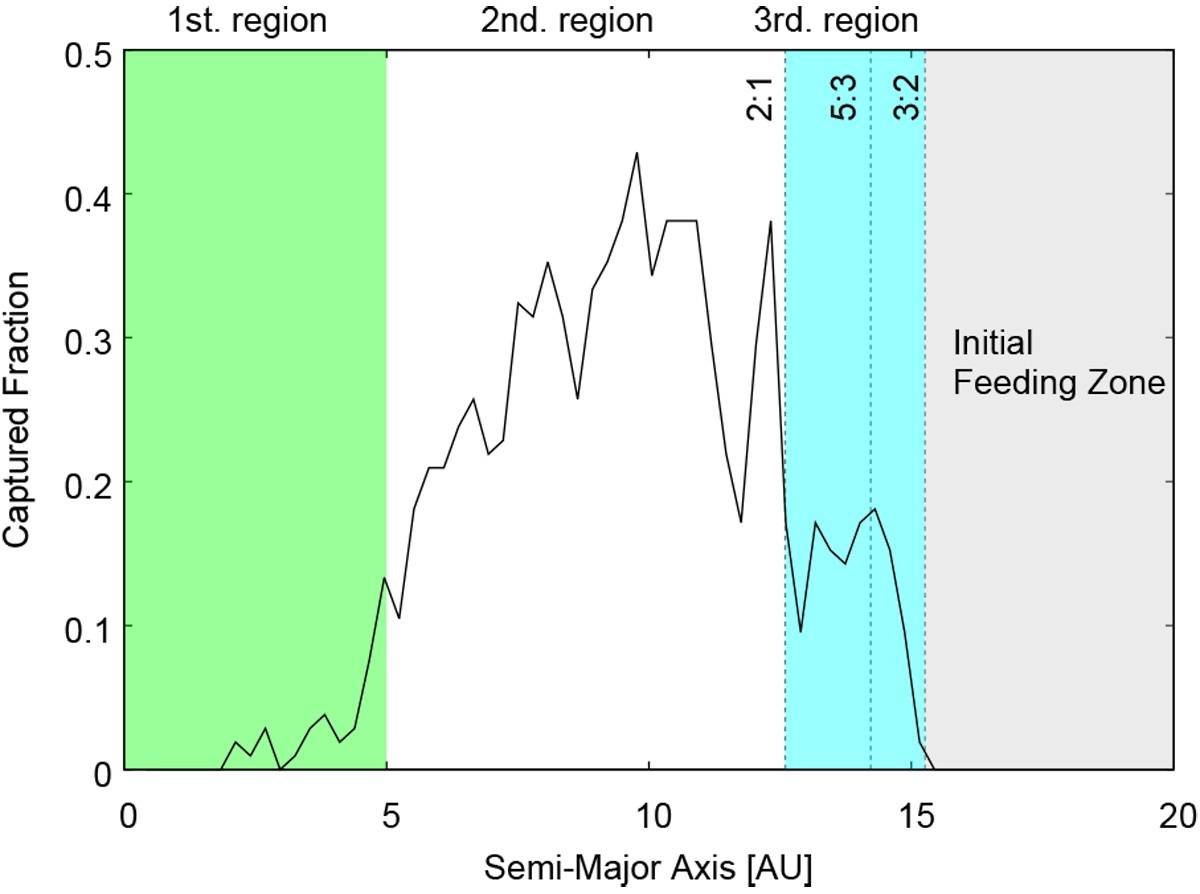
Fraction of planetesimals captured by the planet versus their source semi-major axis for the reference case. Green, white, and turquoise areas correspond to the first, second, and third regions, respectively, denoted in Sect. 3.2. The difference between these regions is due to the different nature of the dominant shepherding process. Gray area shows the initial planetary feeding zone for planetesimals in circular orbits (e = 0). Dotted lines indicate the positions of the 2:1, 5:3, and 3:2 MMRwith the planet at the beginning of the simulation. The bin width of the histogram is 1∕3 AU.
Current usage metrics show cumulative count of Article Views (full-text article views including HTML views, PDF and ePub downloads, according to the available data) and Abstracts Views on Vision4Press platform.
Data correspond to usage on the plateform after 2015. The current usage metrics is available 48-96 hours after online publication and is updated daily on week days.
Initial download of the metrics may take a while.