Fig. C.4
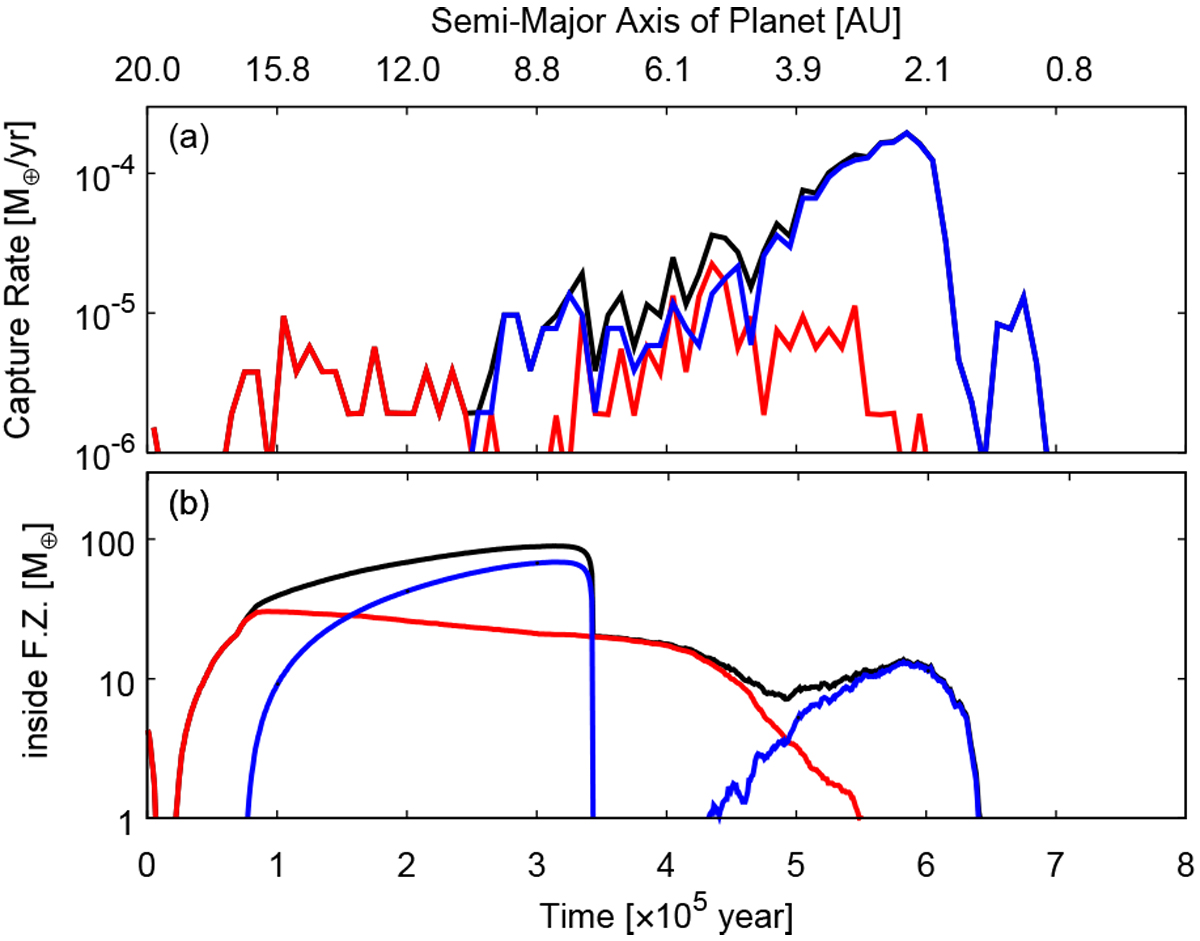
Temporal changes in (a) the capture rate of planetesimals and (b) the total mass of planetesimals inside the feeding zonein the reference case (see Table 1 for the setting). Red and blue lines show the contributions of planetesimals initially located on the side far from and close to the central star relative to the initial position of the 2:1 mean motion resonance (12.6 AU), respectively; the black one shows all the contributions. Top x-axis shows the semi-major axis of the migrating planet.
Current usage metrics show cumulative count of Article Views (full-text article views including HTML views, PDF and ePub downloads, according to the available data) and Abstracts Views on Vision4Press platform.
Data correspond to usage on the plateform after 2015. The current usage metrics is available 48-96 hours after online publication and is updated daily on week days.
Initial download of the metrics may take a while.