Fig. C.1
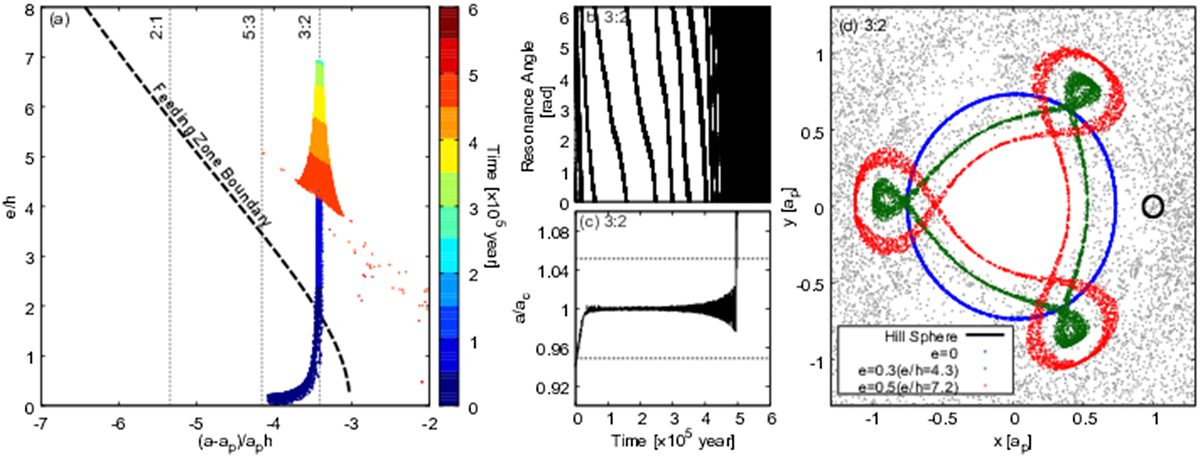
Orbital evolution of a single planetesimal initially located at the semi-major axis ap,0 = 14.3 AU. Panel a: the evolutionary path of the planetesimal in the plane whose vertical and horizontal axes are the eccentricity, e, and the difference in semi-major axis between the planetesimal, a and planet, ap, respectively;both are normalised by the reduced Hill radius, h (see Eq. (20)). The time sequence is colour-coded. Dashed line indicates the boundary of the feeding zone. Dotted lines are eye-guide ones that show the resonance centre of the 2:1, 5:3 and 3:2 mean motion resonances (MMRs) with the planet, from left to right. Panels b and c: the temporal changes in the resonance angle (see Eq. (C.5)) and in the semi-major axis of the planetesimal normalised by that of the resonance centre, ac (see Eq. (C.2)), respectively, for the 3:2 MMR. The dotted lines indicate the resonant width of the 3:2 MMR. Panel d: the orbits of the planetesimal on the co-rotating flame with themigrating planet. Blue, green and red dots show the path of the planetesimal for e = 0, 0.2 and 0.4, respectively.The gray dots show the orbit of the planetesimal after escaping from the resonance. The black circle shows the Hill sphere of the planet.
Current usage metrics show cumulative count of Article Views (full-text article views including HTML views, PDF and ePub downloads, according to the available data) and Abstracts Views on Vision4Press platform.
Data correspond to usage on the plateform after 2015. The current usage metrics is available 48-96 hours after online publication and is updated daily on week days.
Initial download of the metrics may take a while.