Fig. 10.
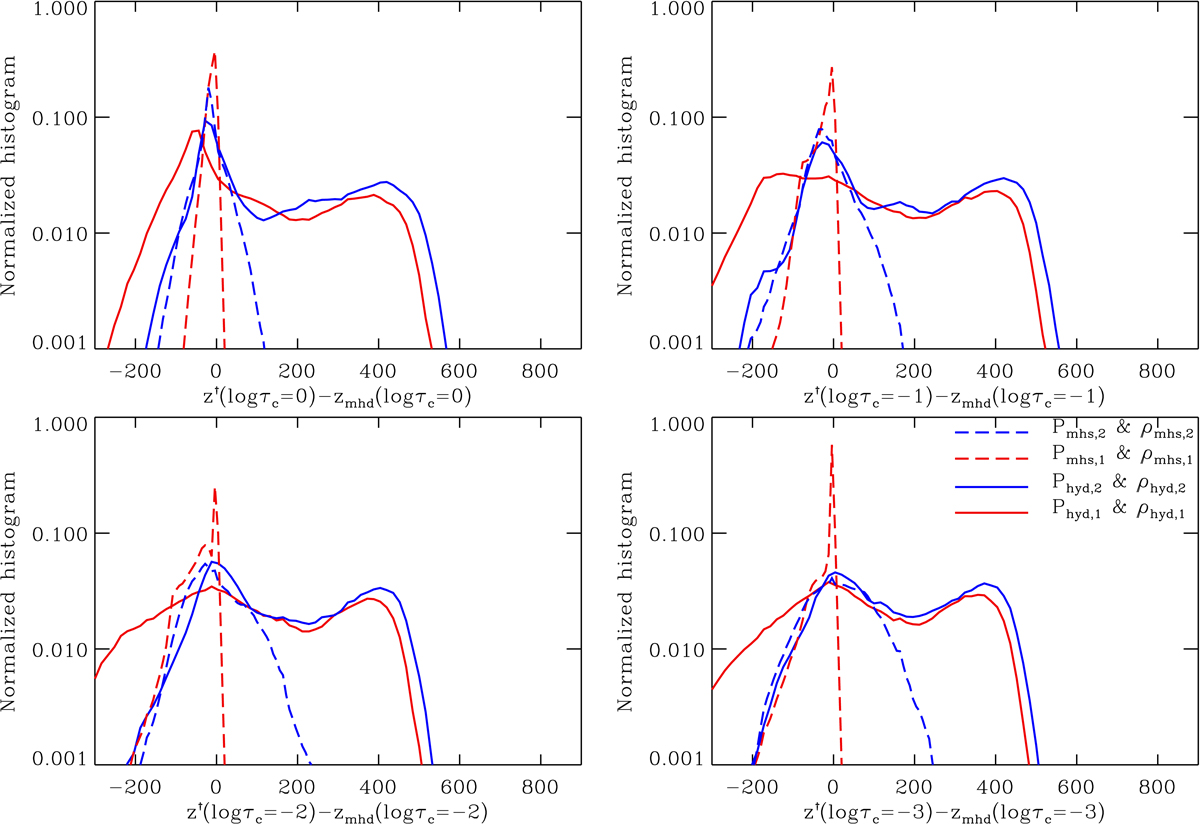
Histograms of the difference between the inferred height z† and the height in the MHD simulations zmhd for different optical-depth levels: log τc = 0 (upper-left), −1 (upper-right), −2 (bottom-left), and −3 (bottom-right). Solid colored lines represent the inferences in the hydrostatic case (red for boundary condition Phyd, 1; blue for boundary condition Phyd, 2), and dashed colored lines display the MHS case (red for boundary condition Pmhs, 1; blue for boundary condition Pmhs, 2). See text for details.
Current usage metrics show cumulative count of Article Views (full-text article views including HTML views, PDF and ePub downloads, according to the available data) and Abstracts Views on Vision4Press platform.
Data correspond to usage on the plateform after 2015. The current usage metrics is available 48-96 hours after online publication and is updated daily on week days.
Initial download of the metrics may take a while.