Fig. 7.
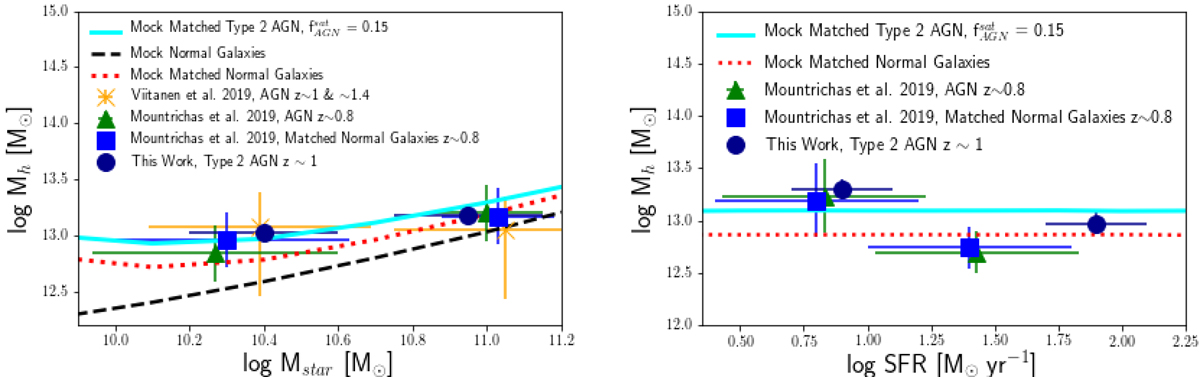
Galaxy stellar mass as a function of dark matter halo mass as derived for CCL Type 2 AGN (dark blue circles) at mean z ∼ 1, XMM-COSMOS AGN (orange stars) at z ∼ 1 (low Mstar) and ∼1.4 (high Mstar) in Viitanen et al. (2019), XMM-XXL AGN (green triangles), and matched normal galaxies (blue squares) in Mountrichas et al. (2019) at mean z ∼ 0.8. The error bars on x-axis represent typical measurement error on the stellar mass estimates of each subsample. The Mstar − Mh and Mstar–SFR relations for matched mock AGN (continuous gray line) and mock matched normal galaxies (dotted red line) are shown. For comparison, the halo-stellar mass relation is shown for the full sample of mock galaxies as a dashed black line.
Current usage metrics show cumulative count of Article Views (full-text article views including HTML views, PDF and ePub downloads, according to the available data) and Abstracts Views on Vision4Press platform.
Data correspond to usage on the plateform after 2015. The current usage metrics is available 48-96 hours after online publication and is updated daily on week days.
Initial download of the metrics may take a while.