Fig. 6.
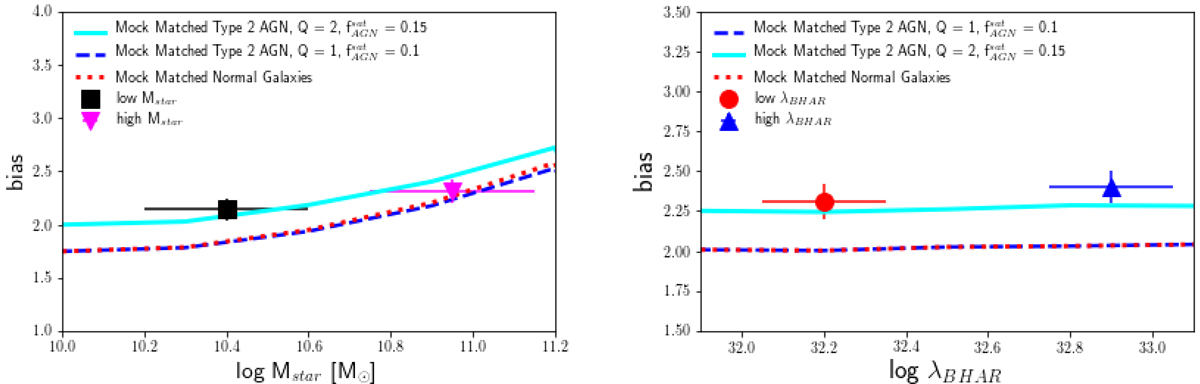
Large-scale bias evolution as a function of host galaxy stellar mass (left panel) and specific BHAR (right panel) for CCL Type 2 AGN and mock AGN. These are matched to have the same host galaxy properties of CCL Type 2 AGN, for Q = 1 and = 2 (according to the legend), which correspond to a relative fraction of satellite AGN ![]() = 0.1 and = 0.15, respectively. The error bars on x-axis represent the typical error on the stellar mass and specific BHAR estimates in COSMOS. For comparison, the red dotted lines show the large-scale bias as a function of Mstar and λBHAR for mock matched normal galaxies.
= 0.1 and = 0.15, respectively. The error bars on x-axis represent the typical error on the stellar mass and specific BHAR estimates in COSMOS. For comparison, the red dotted lines show the large-scale bias as a function of Mstar and λBHAR for mock matched normal galaxies.
Current usage metrics show cumulative count of Article Views (full-text article views including HTML views, PDF and ePub downloads, according to the available data) and Abstracts Views on Vision4Press platform.
Data correspond to usage on the plateform after 2015. The current usage metrics is available 48-96 hours after online publication and is updated daily on week days.
Initial download of the metrics may take a while.