Free Access
Fig. 2.
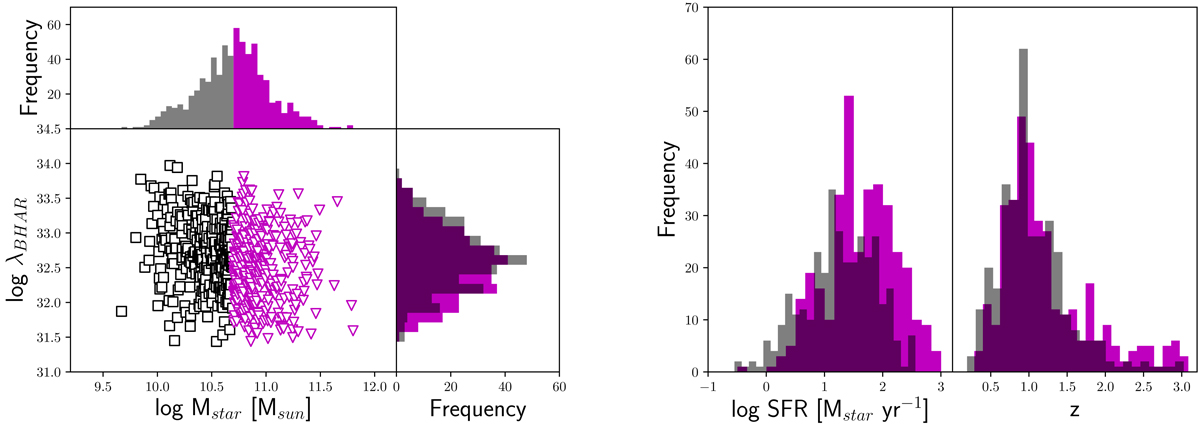
Host galaxy stellar mass as a function of specific BHAR (left panel) for low (log Mstar/[M⊙] ≲ 10.75) and high (> 10.75) stellar mass subsamples. The corresponding distribution in terms of Mstar, λBHAR, SFR, and spectroscopic redshift (right panel) are shown for the two AGN subsets.
Current usage metrics show cumulative count of Article Views (full-text article views including HTML views, PDF and ePub downloads, according to the available data) and Abstracts Views on Vision4Press platform.
Data correspond to usage on the plateform after 2015. The current usage metrics is available 48-96 hours after online publication and is updated daily on week days.
Initial download of the metrics may take a while.