Fig. 1.
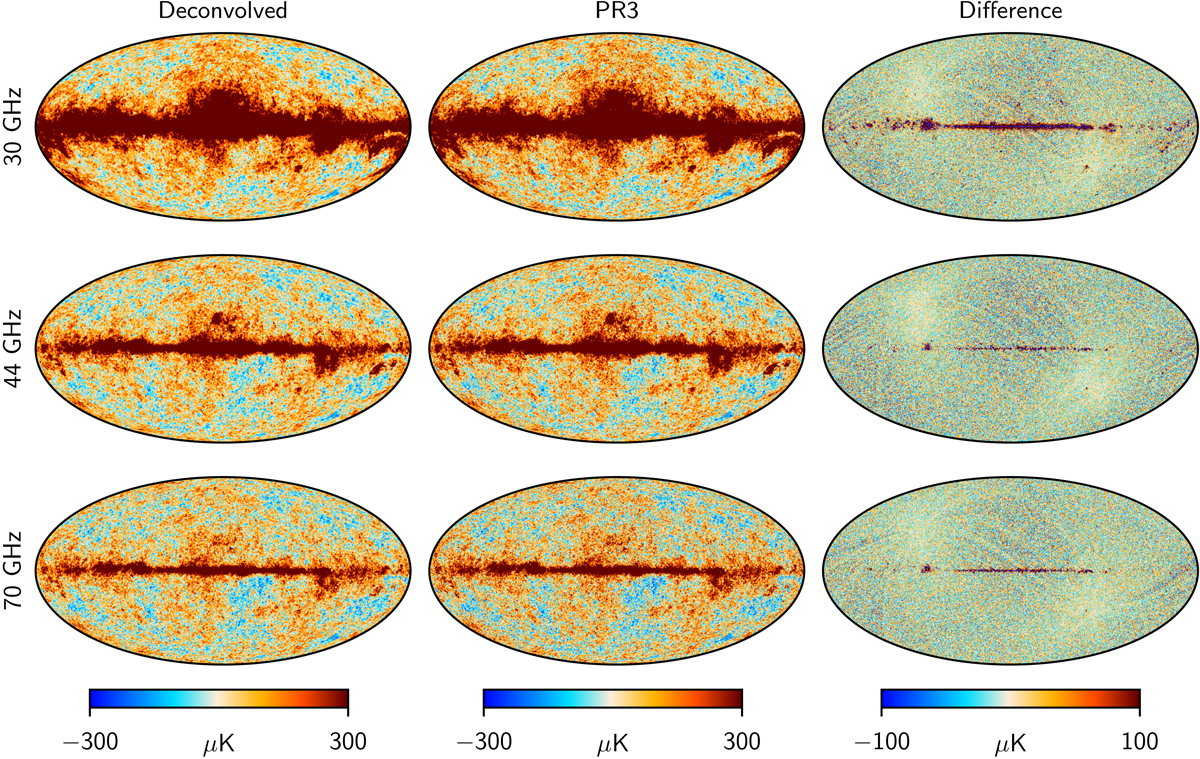
From left to right: deconvolved temperature maps for 30, 44, and 70 GHz, corresponding PR3 maps, and differences between the two. The data include four years of observations for all radiometers of the respective frequency channel. The deconvolved maps are smoothed with a Gaussian beam of FWHM = 40′ (30 GHz), 30′ (44 GHz), or 20′ (70 GHz). We subtracted from the deconvolved maps the same monopole that had been subtracted from the PR3 map. The difference maps are dominated by white noise, which is suppressed in the deconvolved maps. The temperature scales of the maps are ±300 μK for temperature and ±100 μK for the difference.
Current usage metrics show cumulative count of Article Views (full-text article views including HTML views, PDF and ePub downloads, according to the available data) and Abstracts Views on Vision4Press platform.
Data correspond to usage on the plateform after 2015. The current usage metrics is available 48-96 hours after online publication and is updated daily on week days.
Initial download of the metrics may take a while.