Fig. 9.
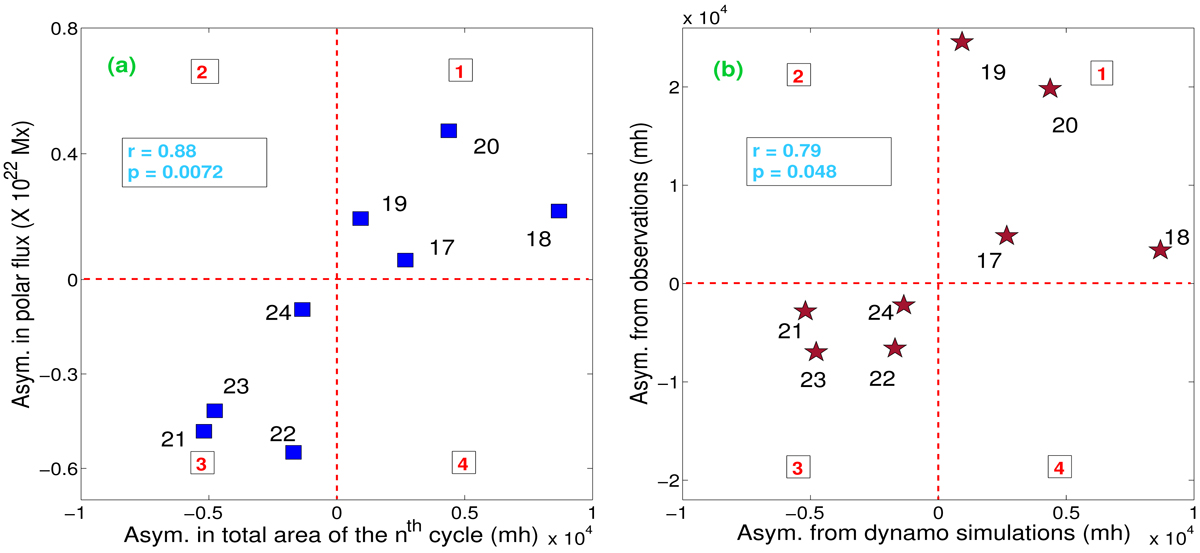
Panel a: hemispheric asymmetry in simulated polar flux (maxwells) during beginning of the nth cycle (“n” varying from 17 to 24) vs. asymmetry (obtained from dynamo simulation) in total sunspot area (in micro-hemispheres) during that cycle. Panel b: asymmetry in the total sunspot area during nth cycle as obtained from dynamo simulation is compared with observation. The associated Pearson’s correlation coefficients, along with the p-values, are mentioned.
Current usage metrics show cumulative count of Article Views (full-text article views including HTML views, PDF and ePub downloads, according to the available data) and Abstracts Views on Vision4Press platform.
Data correspond to usage on the plateform after 2015. The current usage metrics is available 48-96 hours after online publication and is updated daily on week days.
Initial download of the metrics may take a while.